Article
Sustainability consideration
CO2 absorption during the use phase of autoclaved aerated concrete by recarbonation

Over the next decades, CO2 released by deacidification during the burning of cement and burnt lime (quicklime) is to a large extent re-absorbed by the building materials produced from them. During this process calcium carbonate forms primarily in the pore spaces, filling them and in so doing, stabilising the matrix of these materials. This ‘recarbonation’ is indicated by an increase in the bulk density and strength of the concrete [2].
Cement and burnt lime are also used as binders in the production of autoclaved aerated concrete (AAC). Because the production of AAC itself requires only little process energy (the products are autoclaved at around 180 °C), more than 80% of the CO2 released throughout the entire production process is derived from the production of raw materials.
In the light of scientific debate about the behaviour of CO2 as a greenhouse gas and the balancing of material flows, there is a need to reassess the release and fixing of CO2 during the life cycle of all construction products. They are accounted for by the global warming potential (GWP) or carbon footprint. Both measures are expressed in kg CO2equivalent, also written as kg CO2e, but they are calculated differently and have different numerical values.
AAC also absorbs CO2 during use. This re-binding of CO2 is referred to as recarbonation, although strictly speaking, only the CaO within the AAC is recarbonated. During this process, CO2 released from carbonatic raw materials during the burning of cement and quicklime is reabsorbed and permanently trapped inside carbonate minerals within the AAC. In the production of AAC, the binders are initially converted to calcium silicate hydrate phases (C-S-H phases), ideally crystalline 11Å tobermorite (Ca5H2[Si3O9]2 ∙ 4 H2O). Over several decades of the service life of the building, the calcium within forms carbonates and absorbs CO2 in the process. As with conventional concrete, this process does not reduce the strength of standardised AAC [3], [4]. This paper is concerned with the slow recarbonation of properly produced, standardised AAC. All samples investigated were collected from intact buildings in service.
Theoretical and normative principles
As early as 2004, Matsuhita published his findings on the carbonation/recarbonation of AAC in his dissertation, including results on the degree of carbonation of AAC [5].
This paper is concerned with the recarbonation of CaO. The following statements refer to EN 16757:2017, as amended by DIN EN 16757:2017-10 [6]. This standard sets out for the first time the basic principles for calculating the carbonation and recarbonation of concretes. AAC belongs to the group of aerated autoclaved lightweight concretes. Annex BB of the aforementioned standard describes CO2 uptake by carbonation and contains guidance on its calculation. “BB.2 Potential CO2 uptake for totally carbonated concrete" states specifically:
“The maximum theoretical CO2 uptake for totally carbonated concrete is correlated to the amount of reactive CaO in the binders. If the w% of reactive CaO is given for a binder the CO2 uptake can be calculated as:
Utcc = w C (mCO2/mCaO) [BB.2] (1)
w is part of reactive CaO [kg CaO / kg binder]
C is the mass of binder (cement + reactive addition) [kg]
mCO2 is the molar weight CO2 = 44 g/mol
mCaO is the molar weight CaO = 56 g/mol”
Using this formula (1), the amount of bound (formerly active) CaO in totally carbonated AAC can be calculated from the amount of CO2 bound in the carbonate by means of stoichiometric calculation.
Because the AAC mixture contains burnt lime as a binder in addition to cement, the formula (1) and [BB.2] are directly applicable to AAC in accordance with the standard. Burnt lime is the reactive additive in this case. The binder content is calculated from the reactive CaO from the cement (based on the assumptions listed in the standard in accordance with BB.3) and from the burnt lime. Thus:
Utcc = ((wcement ∙ Ccement) + (wquicklime ∙ Cquicklime)) ∙ (mCO2/mCaO) (2)
For recarbonation it is irrelevant whether the CaOreactive originates from the cement or the burnt lime. Thus the following applies to the formulation:
Wtotal = (wcement ∙ Ccement) + (wquicklime ∙ Cquicklime) (3)
and thus
Utcc = wtotal ∙ (mCO2/mCaO) (4)
When investigating old AAC materials with unknown formulations, w is calculated on the basis of the chemical analysis. In this case the analysed quantity of CaO is reduced by the quantity of CaO which is bound in sulphates and carbonates. However, when it comes to calculating the Utcc, the amount of CaO bound in carbonates is not relevant and only the amount bound in sulphates is considered. The siliceous binding of CaO in sand materials that also occurs is disregarded at this point. If the initial mineralogical composition of a sand is not known, it cannot be determined from the product. The method described above whereby the siliceous binding of CaO in sand materials is disregarded does not lead to an overestimation of the degree of carbonation. Instead, it is underestimated.
And thus here too
Utcc = w ∙ (mCO2/mCaO) (5)
The degree of carbonation is used to assess carbonation and/or recarbonation. This measure indicates how much calcium carbonate has already formed at time x based on the maximum possible value. What is the current state? – does the recarbonation process continue or has it already finished at the time of analysis?
Uxcc stands for the CO2 content of carbonated AAC at time x. The degree of carbonation DC is calculated as follows
DC = Uxcc / Utcc (6)
The degree of carbonation DC can be calculated from the chemical analysis, whereby the measured value for the carbonate-bound CO2 is used for Uxcc and Utcc is calculated from the active CaO content pursuant to (5). For total carbonation
Uxcc = Utcc = 1.
EN 16757:2017 further states:
“Often just the total CaO is given and it is normally between 60 % und 65 % of the cement weight. Reactive CaO can be calculated by subtracting such unreactive forms of CaO, as carbonates and sulfates from the total CaO. …” This is reflected by the previous statements. The standard continues:
“As a conservative approach calculation can be done with the CaO from the clinker only.
Utcc = w ∙ CC ∙ (mCO2/mCaO) [BB.3] (7)
where
CC is the mass of clinker [kg]
Portland cement includes at least 95 % clinker and a typical value for reactive CaO is 65 %.”
On this basis, Portland cement has a reactive CaO content of 62% (95% clinker with 65% CaOreactive). Portland cements are used almost exclusively in AAC production, which is why this correlation may be applied to the production cements of AAC plants.
Table 1 below applies to the burnt lime also used, pursuant to DIN EN 459-1:2015-07) [7] Table 2 (extract):
Table 1: Extract from Table 2 of DIN EN 459-1:2015-07 – Chemical requirements of white lime, defined as characteristic values
Type of calcium lime | Values given as mass fraction in percent | ||||
CaO + MgO | MgOa | CO2b | SO3 | Available limec | |
CL 90 | ≥ 90 | ≤ 5 | ≤ 4 | ≤ 2 | ≥ 80 |
CL 80 | ≥ 80 | ≤ 5 | ≤ 7 | ≤ 2 | ≥ 65 |
CL 70 | ≥ 70 | ≤ 5 | ≤ 12 | ≤ 2 | ≥ 55 |
In reality, however, the content of available lime for quicklime used in aerated concrete plants is higher, higher percentages may be called for according to “Note c”. It is thus assumed below that the widely used burnt lime CL 90 actually contains 90 wt% CaOreactive and CL 80 80 wt% accordingly.
The Ca(OH)2 sometimes present in burnt lime as an impurity resulting from hydration in air is also incorporated into the C-S-H phases and is available for recarbonation. Unconverted limestone is still present as carbonate (Ca[CO]3) and the CaO bound in it should not be taken into account.
Study of the variability of recarbonation through the wall cross-section
The aim was to shed light on the degree of homogeneity of the natural recarbonation of AAC through the wall cross-section. Do carbonation fronts occur as with concrete [8], [9], or does the process take place uniformly across the entire masonry block?
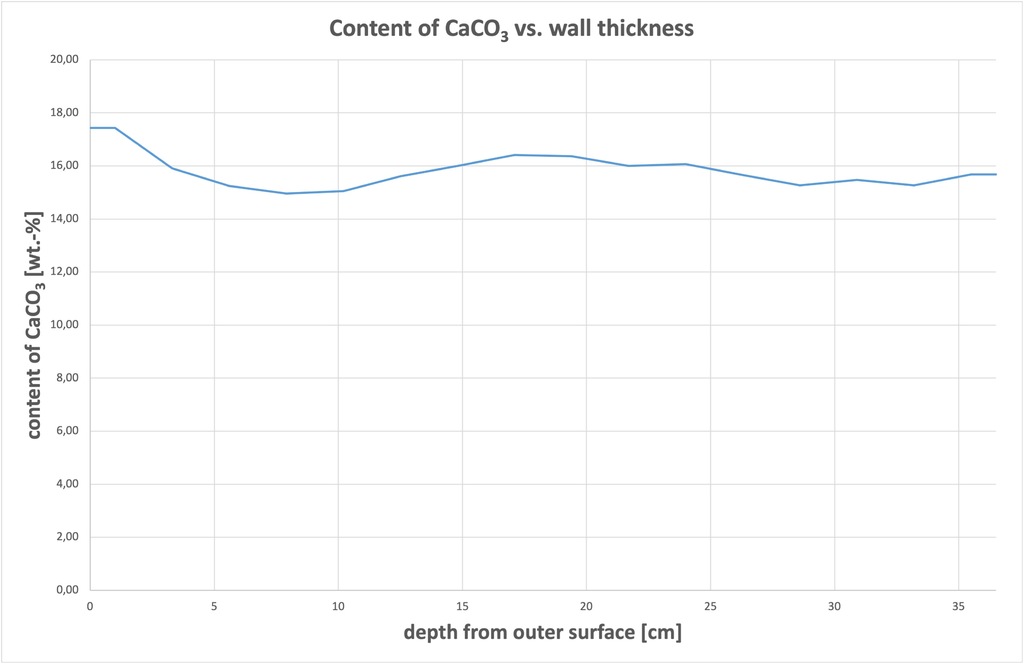
A 16-year-old, 36.5 cm thick external house wall made of PP2-400 was investigated for the purpose of the study. First a prism was cut dry from the wall and then sawn into 20 mm thick slices. Allowing for a 3 mm saw slot, this yielded 16 samples in total. Sample 1 was coated in silicate exterior render and Sample 16 in gypsum interior plaster. All samples were milled < 63 µm before undergoing CS analysis (Table 2). In addition, the complete chemical composition of three samples (1-outer surface, 8-centre and 16-inner surface) was analysed by means of X-ray fluorescence analysis (XRF) (Table 3). The mean analytical value for total CaO of 28.39 wt% was used to calculate the degree of recarbonation in Table 2.
Table 2: CO2 and SO3 contents of a 16-year-old external wall made from PP2-400; the 16 samples are distributed evenly through the wall cross-section
CO2 total [1] | [% by weight] | 7.67 | 7.00 | 6.71 | 6.58 | 6.62 | 6.87 | 7.04 | 7.22 | 7.20 | 7.04 | 7.07 | 6.89 | 6.72 | 6.81 | 6.72 | 6.90 |
SO3 total [2] | [% by weight] | 2.68 | 2.94 | 2.94 | 2.87 | 2.98 | 2.95 | 2.97 | 3.03 | 2.97 | 3.00 | 2.98 | 3.00 | 2.91 | 2.90 | 2.94 | 2.98 |
CaCO3 calculated from CO2 [3] | [% by weight] | 17.43 | 15.91 | 15.25 | 14.95 | 15.05 | 15.61 | 16.00 | 16.41 | 16.36 | 16.00 | 16.07 | 15.66 | 15.27 | 15.48 | 15.27 | 15.68 |
CaO in CaCO3 calculated [4] | [% by weight] | 9.76 | 8.91 | 8.54 | 8.37 | 8.43 | 8.74 | 8.96 | 9.19 | 9.16 | 8.96 | 9.00 | 8.77 | 8.55 | 8.67 | 8.55 | 8.78 |
Ca[SO4] calculated from SO3 [5] | [% by weight] | 4.56 | 5.00 | 5.00 | 4.88 | 5.07 | 5.02 | 5.05 | 5.15 | 5.05 | 5.10 | 5.07 | 5.10 | 4.95 | 4.93 | 5.00 | 5.07 |
CaO in Ca[SO4] calc. [6] | [% by weight] | 1.88 | 2.06 | 2.06 | 2.01 | 2.09 | 2.07 | 2.08 | 2.12 | 2.08 | 2.10 | 2.09 | 2.10 | 2.04 | 2.03 | 2.06 | 2.09 |
degree of recarbonation Dc [7] | [ - ] | 0.37 | 0.34 | 0.32 | 0.32 | 0.32 | 0.33 | 0.34 | 0.35 | 0.35 | 0.34 | 0.34 | 0.33 | 0.32 | 0.33 | 0.32 | 0.33 |
[1] | measured value | |||||
[2] | measured value | |||||
[3] | CCaCO3 = CCO2 / mCO2 * mCaCO3 | mCO2 = 44 g/mol. mCaCO3 = 100 g/mol | ||||
[4] | CCaO = CCaCO3 / mCaCO3 * mCaO | mCaO = 56 g/mol | ||||
[5] | CCaSO4 = CSO3 / mSO3 * mCaSO4 | mSO3 = 80 g/mol. mCaSO4 = 136 g/mol | ||||
[6] | CCaO = CCaSO4 / mCaSO4 * mCaO | |||||
[7] | Dc = Uxcc / Utcc = CCaO[4] / (CCaO[total] - CCaO[6]) | CCaO[total] = 28.39 % by weight. mean value from table 3 | ||||
Table 3: Complete chemical analysis of one sample from each of the outer sides and one sample from the centre of a 16-year-old external wall made from PP2-400
| sample 1 | sample 8 | sample 16 | |
SiO2 | [% by weight] | 45.97 | 47.28 | 46.89 |
TiO2 | [% by weight] | < 0.05 | < 0.05 | < 0.05 |
Al2O3 | [% by weight] | 2.22 | 2.26 | 2.24 |
Fe2O3 | [% by weight] | 0.79 | 0.81 | 0.81 |
Mn3O4 | [% by weight] | < 0.05 | < 0.05 | < 0.05 |
MgO | [% by weight] | 0.52 | 0.51 | 0.51 |
CaO | [% by weight] | 28.29 | 28.40 | 28.47 |
Na2O | [% by weight] | < 0.05 | < 0.05 | < 0.05 |
K2O | [% by weight] | 0.75 | 0.59 | 0.58 |
P2O5 | [% by weight] | < 0.05 | < 0.05 | < 0.05 |
Loss on ignition (L.o.i.) | [% by weight] | 17.12 | 16.33 | 16.05 |
CO2 | [% by weight] | 7.67 | 7.22 | 6.9 |
SO3 | [% by weight] | 2.68 | 3.03 | 2.98 |
H2O calculated | [% by weight] | 9.45 | 9.11 | 9.15 |
The CO2 content showed highly uniform distribution across the wall, see Figure 1. All samples contained around 7 wt% CO2 and a calculated 15.0 – 17.4 wt% CaCO3. The highest values are found in Sample 1, taken from the outside of the masonry. It is worth noting that the building was not rendered for six months initially, during which time the surface was directly exposed to the weather.
((Fig. 1))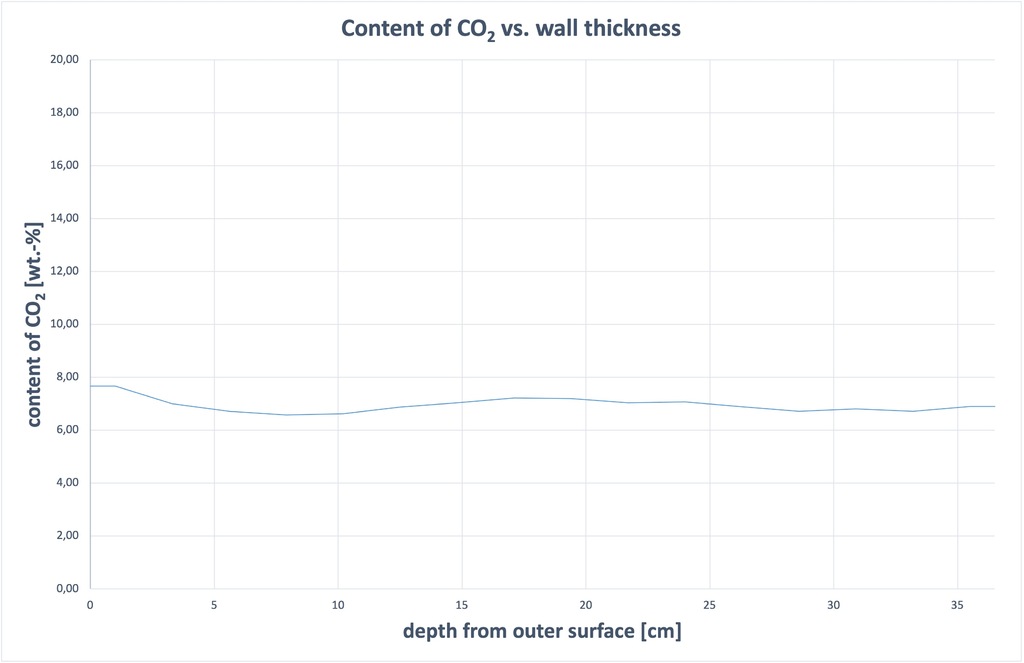
Based on the distribution of CO2 ascertained through the cross-section of the masonry, it was decided to further investigate natural recarbonation by examining drill dust samples. This simplified the sampling process for existing buildings as it was no longer necessary to obtain drill core samples through the entire wall cross-section.
Analysis of the field study
Various analytical methods can be used to determine the amount of CO2 bound within the AAC in the form of carbonate: quantitative X-ray phase analysis and subsequent Rietveld calculation, for example, identifies and quantifies the carbonate minerals. The proportion of carbonate minerals can also be determined by thermal analysis. Furthermore, it is also possible to determine the CO2 directly in the material and quantify it by infrared spectroscopy. Xella mainly uses the latter method because the degree of recarbonation can be calculated from the other chemical data obtained by XRF at the same time (see above).
During a study of AAC samples aged from 25 to over 40 years conducted in 2007 [10], Straube found that the samples occasionally contained more CO2 than their CaO content would allow – calcium carbonate naturally forms limestone, which consists mainly of the mineral calcite (CaCO3). Natural limestone often also contains small quantities of dolomite, a calcium magnesium carbonate (CaMg[CO3]2). Thus, during the burning of lime, both the calcite and the dolomite decompose and release CO2. This means that reactive MgO is also present in the cement or burnt lime, in addition to the reactive CaO. The MgO also reacts in the autoclave during AAC production and is bound in C-S-H phases. The MgO is subsequently recarbonated as well. Whether the MgO forms magnesite (MgCO3) during recarbonation or reacts with CaO to re-form dolomite (CaMg[CO3]2) is irrelevant in this context.
((Fig. 2))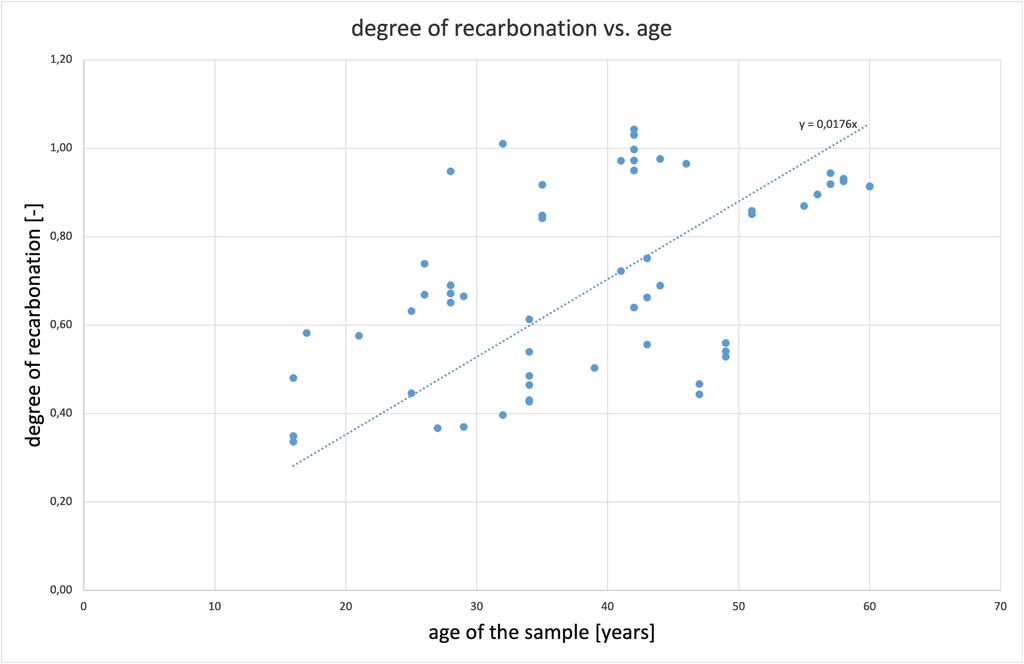
Assuming that, AAC buildings have a service life of 80 years, the recarbonation of the material is not expected to last this long. According to the present data, AAC is recarbonised to around 70% after 40 years, 88% after 50 years and recarbonation is complete in less than 60 years. A conservative estimate assumes a 95 percent degree of recarbonation DC = 95% at the end of the service life and DC = 80% after 50 years.
Table 4: Data obtained from analysis of the samples
No. | age of the material | analysed values | calculated values | |||||||
CO2 | SO3 | CaO | Ca[SO4] according to SO3 | CaO | residual CaO without Ca[SO4] | CaCO3 maximum according residual CaO | CO2 in CaCO3 maximum | degree of recarbonation | ||
| [a] | [% by weight] | [% by weight] | [% by weight] | [% by weight] | [% by weight] | [% by weight] | [% by weight] | [% by weight] | [ - ] |
1 | 16 | 6.94 | 2.94 | 28.39 | 5.00 | 2.06 | 26.33 | 46.97 | 20.66 | 0.34 |
2 | 16 | 9.09 | 1.76 | 24.92 | 2.99 | 1.23 | 23.69 | 42.26 | 18.58 | 0.49 |
3 | 16 | 6.15 | 2.09 | 23.56 | 3.55 | 1.46 | 22.10 | 39.42 | 17.33 | 0.35 |
4 | 17 | 11.73 | 4.49 | 28.82 | 7.64 | 3.15 | 25.67 | 45.80 | 20.14 | 0.58 |
5 | 21 | 11.73 | 2.05 | 27.40 | 3.48 | 1.43 | 25.97 | 46.32 | 20.37 | 0.58 |
6 | 25 | 7.29 | 2.14 | 22.35 | 3.64 | 1.50 | 20.85 | 37.20 | 16.36 | 0.45 |
7 | 25 | 11.14 | 0.76 | 23.01 | 1.29 | 0.53 | 22.48 | 40.10 | 17.63 | 0.63 |
8 | 26 | 12.30 | 2.01 | 24.47 | 3.42 | 1.41 | 23.06 | 41.14 | 18.09 | 0.68 |
9 | 26 | 13.86 | 2.06 | 24.98 | 3.50 | 1.44 | 23.54 | 41.99 | 18.47 | 0.75 |
10 | 27 | 6.23 | 2.75 | 23.55 | 4.67 | 1.92 | 21.63 | 38.58 | 16.97 | 0.37 |
11 | 28 | 10.00 | 0.89 | 20.21 | 1.51 | 0.62 | 19.59 | 34.94 | 15.37 | 0.65 |
12 | 28 | 10.34 | 0.82 | 20.20 | 1.39 | 0.57 | 19.63 | 35.01 | 15.40 | 0.67 |
13 | 28 | 10.54 | 0.76 | 20.01 | 1.29 | 0.53 | 19.48 | 34.75 | 15.28 | 0.69 |
14 | 28 | 14.49 | 1.28 | 20.38 | 2.18 | 0.90 | 19.48 | 34.76 | 15.29 | 0.95 |
15 | 29 | 11.98 | 2.47 | 24.68 | 4.20 | 1.73 | 22.95 | 40.94 | 18.00 | 0.67 |
16 | 29 | 5.91 | 3.00 | 22.49 | 5.10 | 2.10 | 20.39 | 36.37 | 16.00 | 0.37 |
17 | 32 | 20.81 | 1.13 | 27.05 | 1.92 | 0.79 | 26.26 | 46.85 | 20.60 | 1.01 |
18 | 32 | 8.43 | 1.65 | 28.27 | 2.80 | 1.15 | 27.12 | 48.37 | 21.27 | 0.40 |
19 | 34 | 9.48 | 0.87 | 20.33 | 1.48 | 0.61 | 19.72 | 35.18 | 15.47 | 0.61 |
20 | 34 | 6.97 | 0.76 | 21.36 | 1.29 | 0.53 | 20.83 | 37.16 | 16.34 | 0.43 |
21 | 34 | 9.19 | 1.98 | 25.52 | 3.37 | 1.39 | 24.13 | 43.05 | 18.93 | 0.49 |
22 | 34 | 8.34 | 3.28 | 25.20 | 5.58 | 2.30 | 22.90 | 40.86 | 17.97 | 0.46 |
23 | 34 | 8.05 | 2.61 | 25.67 | 4.44 | 1.83 | 23.84 | 42.53 | 18.70 | 0.43 |
24 | 34 | 8.06 | 1.85 | 20.35 | 3.14 | 1.29 | 19.06 | 34.00 | 14.95 | 0.54 |
25 | 35 | 14.30 | 0.34 | 21.89 | 0.58 | 0.24 | 21.65 | 38.63 | 16.99 | 0.84 |
26 | 35 | 13.75 | 0.28 | 21.02 | 0.48 | 0.20 | 20.82 | 37.15 | 16.34 | 0.84 |
27 | 35 | 14.87 | 0.25 | 20.84 | 0.43 | 0.18 | 20.66 | 36.87 | 16.21 | 0.92 |
28 | 35 | 13.91 | 0.31 | 21.12 | 0.53 | 0.22 | 20.90 | 37.29 | 16.40 | 0.85 |
29 | 39 | 8.79 | 3.50 | 24.74 | 5.94 | 2.45 | 22.29 | 39.77 | 17.49 | 0.50 |
30 | 41 | 16.64 | 0.24 | 21.61 | 0.41 | 0.17 | 21.44 | 38.25 | 16.82 | 0.99 |
31 | 41 | 13.14 | 0.90 | 23.37 | 1.53 | 0.63 | 22.74 | 40.57 | 17.84 | 0.74 |
32 | 42 | 18.13 | 0.40 | 24.05 | 0.68 | 0.28 | 23.77 | 42.41 | 18.65 | 0.97 |
33 | 42 | 18.92 | 0.39 | 23.68 | 0.66 | 0.27 | 23.41 | 41.76 | 18.36 | 1.03 |
34 | 42 | 18.45 | 0.37 | 23.85 | 0.63 | 0.26 | 23.59 | 42.09 | 18.51 | 1.00 |
35 | 42 | 17.50 | 0.31 | 21.61 | 0.53 | 0.22 | 21.39 | 38.16 | 16.78 | 1.04 |
36 | 42 | 19.79 | 0.20 | 26.69 | 0.34 | 0.14 | 26.55 | 47.37 | 20.83 | 0.95 |
37 | 42 | 12.82 | 1.22 | 26.41 | 2.08 | 0.86 | 25.55 | 45.59 | 20.05 | 0.64 |
38 | 43 | 12.87 | 0.80 | 25.32 | 1.36 | 0.56 | 24.76 | 44.17 | 19.42 | 0.66 |
39 | 43 | 14.54 | 0.60 | 25.10 | 1.02 | 0.42 | 24.68 | 44.03 | 19.36 | 0.75 |
40 | 43 | 8.79 | 3.25 | 22.45 | 5.52 | 2.27 | 20.18 | 35.99 | 15.83 | 0.56 |
41 | 44 | 10.23 | 1.81 | 20.19 | 3.08 | 1.27 | 18.92 | 33.76 | 14.84 | 0.69 |
42 | 44 | 15.60 | 0.30 | 20.58 | 0.51 | 0.21 | 20.37 | 36.34 | 15.98 | 0.98 |
43 | 46 | 19.42 | 0.22 | 25.81 | 0.38 | 0.16 | 25.65 | 45.76 | 20.13 | 0.96 |
44 | 47 | 8.79 | 2.50 | 27.05 | 4.25 | 1.75 | 25.30 | 45.14 | 19.85 | 0.44 |
45 | 47 | 6.60 | 0.75 | 18.54 | 1.27 | 0.52 | 18.02 | 32.14 | 14.13 | 0.47 |
46 | 49 | 10.63 | 2.75 | 26.97 | 4.67 | 1.92 | 25.05 | 44.68 | 19.65 | 0.54 |
47 | 49 | 8.79 | 2.75 | 21.97 | 4.67 | 1.92 | 20.05 | 35.76 | 15.73 | 0.56 |
48 | 49 | 10.63 | 3.00 | 27.73 | 5.09 | 2.10 | 25.63 | 45.73 | 20.11 | 0.53 |
49 | 51 | 14.05 | 0.59 | 20.79 | 1.00 | 0.41 | 20.38 | 36.35 | 15.99 | 0.88 |
50 | 51 | 12.45 | 1.74 | 19.28 | 2.96 | 1.22 | 18.06 | 32.22 | 14.17 | 0.88 |
51 | 55 | 17.18 | 0.67 | 24.64 | 1.14 | 0.47 | 24.17 | 43.12 | 18.96 | 0.91 |
52 | 56 | 14.11 | 0.32 | 20.31 | 0.54 | 0.22 | 20.09 | 35.83 | 15.76 | 0.90 |
53 | 57 | 18.32 | 0.20 | 25.56 | 0.34 | 0.14 | 25.42 | 45.35 | 19.94 | 0.92 |
54 | 57 | 17.95 | 0.17 | 24.37 | 0.30 | 0.12 | 24.25 | 43.26 | 19.02 | 0.94 |
55 | 58 | 15.76 | 0.22 | 21.87 | 0.38 | 0.16 | 21.71 | 38.74 | 17.03 | 0.92 |
56 | 58 | 15.76 | 0.17 | 21.69 | 0.30 | 0.12 | 21.57 | 38.48 | 16.92 | 0.93 |
57 | 60 | 15.76 | 0.17 | 22.10 | 0.30 | 0.12 | 21.98 | 39.21 | 17.24 | 0.91 |
58 | 60 | 15.76 | 0.12 | 22.07 | 0.21 | 0.09 | 21.98 | 39.22 | 17.25 | 0.91 |
Calculating the expected recarbonation during the service life of the building
The initial weights are used to calculate the individual recarbonation of special products and recipes. Calculation of these data for life-cycle analyses and in particular environmental product declarations (EPDs) is based on average recipes and annual consumptions of raw materials and energy.
Pursuant to equation (3), the values indicated in Table 5 apply to Portland cement and burnt lime, which are the most widely used binders.
Table 5: Typical values for the CO2 uptake capacity of different binders in accordance with DIN EN 16757:2017-10 and DIN EN 459-1:2015-07
| declared unit | content of CaOactive | maximum possible | CO2 uptake |
| [kg] | [kg] | [kg] | [kg] |
Portland cement CEM I | 1 | 0.620 | 0.487 | 0.463 |
Quicklime CL 90 | 1 | 0.900 | 0.707 | 0.672 |
Quicklime CL 80 | 1 | 0.800 | 0.629 | 0.597 |
The amount of CO2 absorbed during the use phase of AAC through recarbonation is directly dependent on the amount of binder required for its production. The values in the right-hand column of Table 5 indicate the minimum reabsorption of CO2 per kilogram of Portland cement and quicklime used.
The AAC recipe also contains recycled fine AAC material. In most cases this has been recently prepared and is not carbonated. The recarbonation potential of this component must also be taken into account when considering individual AAC products or recipes. Many recipes contain 10 or more percent by weight of these recycled materials.
The following example AAC PP2 recipe (Table 6, modified in accordance with [12]) applies for a bulk density of 362 kg/m³.
Table 6: Example recipe
Component | Content |
[% by weight] | |
Sand | 47 |
Quicklime | 14 |
Cement | 20 |
Recycled AAC | 15 |
Anhydrite | 4 |
Total | 100 |
After autoclaving, AAC contains around 8 wt% water bound in tobermorite which must be taken into account in the initial weight based on bulk density, Table 7.
Table 7: Absolute initial weights in kg/m³ and typical values for the raw materials based on the sample recipe in Table 5
component | content | CaOactive | CaOactive | UTCC | U95 |
| [kg/m³] | [%] | [kg/m³] | [kg/m³] | [kg/m³] |
sand | 157.6 | - | - | - | - |
quicklime | 46.9 | 90 | 42.2 | 33.2 | 31.5 |
cement | 67.0 | 62 | 41.6 | 32.7 | 31.0 |
recycled AAC* | 50.3 | 27 | 13.5 | 10.6 | 10.1 |
anhydrite | 13.4 | 0 | 0.0 | 0.0 | 0.0 |
bound water | 26.8 | 0 | 0.0 | 0.0 | 0.0 |
Total | 362.0 | - | 97.3 | 76.5 | 72.6 |
* the amount of CaOactiv in the recycled material corresponds to the average amount for this recipe
For Dc = 95%, recarbonation thus reduces the GWP of CL 90 burnt lime by 0.672 kg CO2eq/kg of the initial value and that of Portland cement by 0.463 kg CO2eq/kg. Thus a 95% recarbonation of the example AAC reduces the carbon footprint and GWP by 72.6 kg/m³ through CO2 uptake during the use phase. This CO2 uptake is referred to as carbon capture.
Autoclaved aerated concretes based on actual production recipes generally contain higher quantities of binder for lightweight to very lightweight products and lower quantities of binder for heavier products, based on the mass percentages in the initial mix. However, this is counteracted by higher bulk densities which are obtained by increasing the total weight of solids in absolute terms – especially ground sand but including all other constituents except aluminium – leading to higher initial weights per volume AAC. The values in Table 8 below were calculated using the actual amounts of CaOactiv from raw material controls and mean quantities from the recipes. For the production plant under consideration, the values for the standard recipes are as follows (Table 8):
Table 8: Data on the carbon capture capacity of different grades of AAC with different bulk densities
| PP2 -350 | PP4-500 | PP4-550 | PP6-650 | |
CaOactive | kg/m³ | 97.3 | 109.1 | 106.9 | 160.3 |
CO2 UTCC | kg/m³ | 76.5 | 85.7 | 84.0 | 126.0 |
CO2 DC = 95 % | kg/m³ | 72.6 | 81.5 | 79.8 | 119.7 |
It is clear that heavier recipes generally contain more binder in kg/m³ than lighter recipes. AACs with different bulk densities at constant compressive strength are the exceptions, see PP4-500 and PP4-550.
Visual appearance of recarbonation
In AAC, CO2 uptake by crystalline C-S-H phases, especially 11Å tobermorite, takes place over several decades, as described above. During this process, the structure of the AAC remains unchanged, see Figure 3.
((Fig. 3))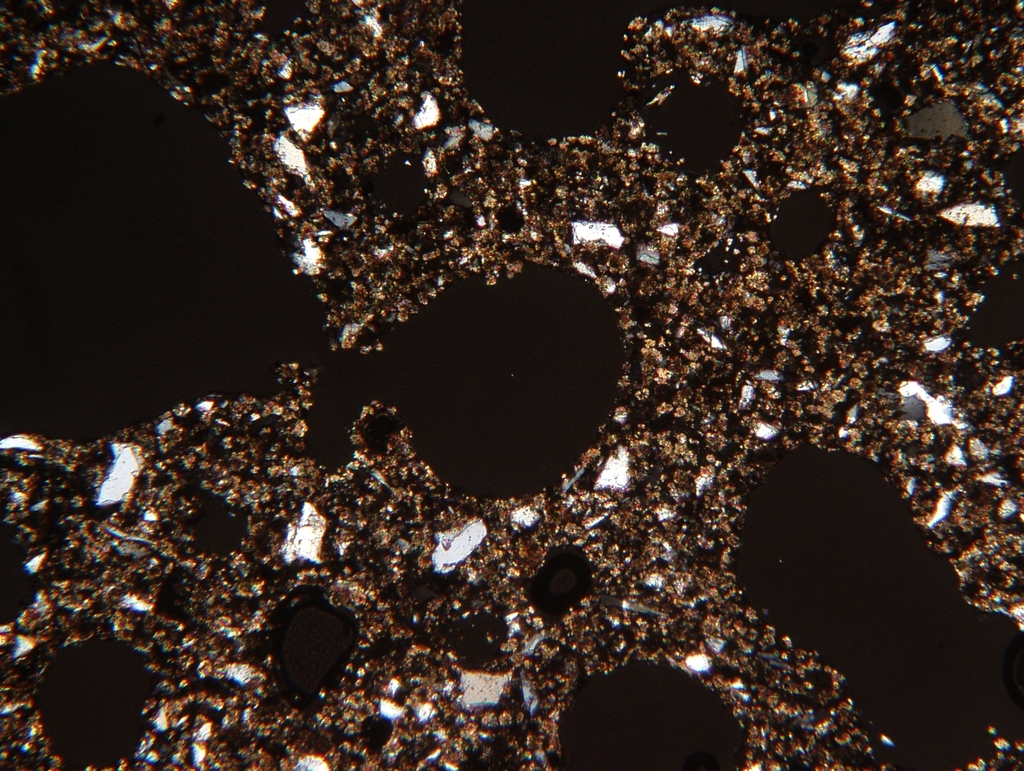
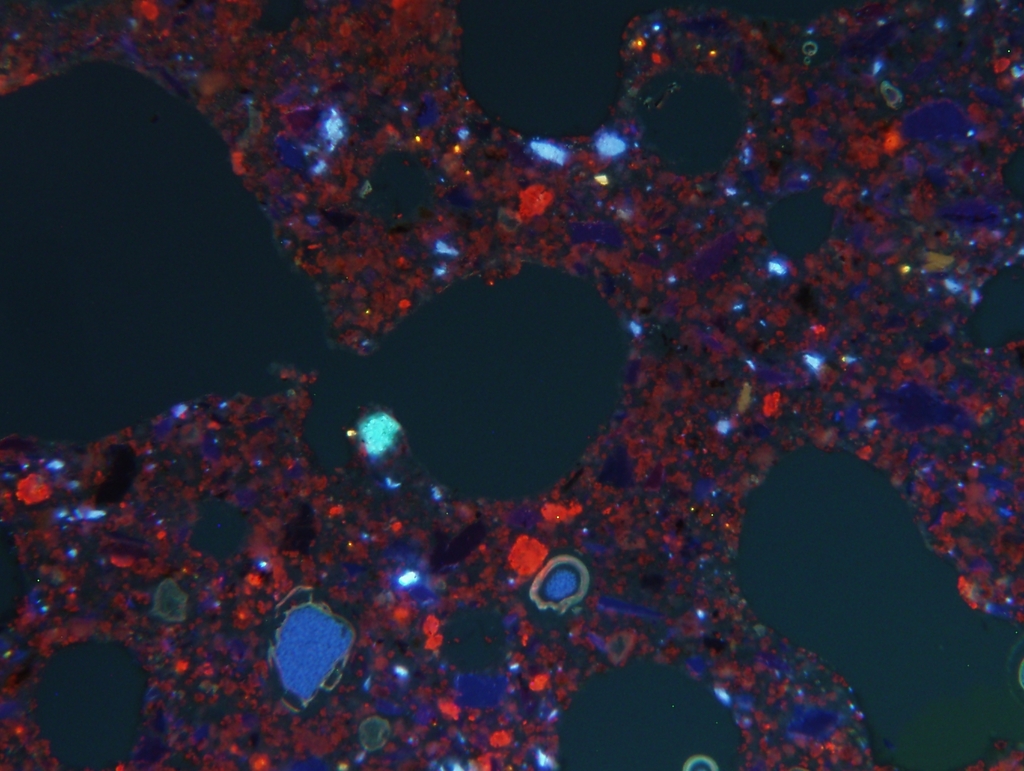
The homogenous violet cathodoluminescence of the supporting structure in the right-hand image is caused by the cathodoluminescence of submicroscopic calcite crystallites. This proves a uniform CO2 uptake across the entire structure, in other words the C-S-H phases have been recarbonated in situ.
The high porosity of AAC enables a continuous process and, in contrast to concrete, prevents the formation of carbonation fronts which are associated with a decrease in pore space, reduced pathways for gases and sealing of the structure. Thus, the uptake of CO2 by AAC is not terminated prematurely but continues until the CaOactive is fully recarbonated. Unlike concrete, in the case of AAC this is achieved without having to dismantle the structure.
Conclusion
The absolute reduction of the carbon footprint or GWP of AAC through recarbonation during the use phase is directly associated with the amounts of binder used. Thus, this reduction can be comprehensively used in the EPD regardless of the background data used. The only prerequisite for its use is that recarbonation is not accounted for in the background data used for cement and burnt lime.
References
[1] BGR – Bundesanstalt für Geowissenschaften und Rohstoffe (2019): Deutschland – Rohstoffsituation 2018. – 144 S.; Hannover.
[2] Kroboth, Karl: Zement / Herstellung - Eigenschaften – Hydratation (1986): in Gesundes Wohnen. Beton-Verlag, Düsseldorf, S. 336-348
[3] Haas, Martin: Carbonation of AAC (2005): in Autoclaved Aerated Concrete ∙ Innovation and Development, Talor & Francis, London/Leiden/New York/Philadelphia/Singapore, S. 265-270
[4] Schoch, Torsten; Straube, Berit & Stumm, Andreas: Dauerhaftigkeit von Porenbeton bei hoher CO2-Beaufschlagung (2011): in Bauphysik 33, H. 5, S. 318-322
[5] Matsushita, Fumiaki: Carbonation of Autoclaved Aerated Concrete and Its Control (2004), Dissertation, 146 S.
[6] DIN EN 16757:2017-10, Nachhaltigkeit von Bauwerken - Umweltproduktdeklarationen - Produktkategorieregeln für Beton und Betonelemente, 58 S.; Deutsche Fassung EN 16757:2017
[7] DIN EN 459-1:2015-07, Baukalk - Teil 1: Begriffe, Anforderungen und Konformitätskriterien, 53 S.; Deutsche Fassung EN 459-1:2015
[8] Hammer, Marcus (2007): Entwicklung mineralogischer Färbetechniken und ihre Anwendung auf spezifische Betonphasen zur Analyse der Zusammensetzung von zementgebundenen Baustoffen, Dissertation an der Martin-Luther-Universität Halle-Wittenberg, 174 S.
[9] Stark, Jochen & Wicht, Bernd (2013): Dauerhaftigkeit von Beton, Springer Vieweg, 479 S.
[10] Straube, Berit (2007), mündliche Mitteilung
[11] Straube, Berit; Langer, Peter & Stumm, Andreas: Durability of Autoclaved Aerated Concrete (2008): in 11DBMC International Conference on Durability of Building Materials and Components, ISTANBUL - TURKEY May 11-14th, 2008
[12] Bundesverband Porenbetonindustrie e.V.: Baustoff (2018): in Porenbeton Handbuch, Hrsg. Bundesverband Porenbetonindustrie e.V., Berlin, (S. 9-21)
Xella Technologie- und Forschungsgesellschaft mbH
Hohes Steinfeld 1,
14797 Kloster Lehnin,Germany
+49 3382 7060112
www.xella.com