Production Technology
Mix design optimization
Measuring the hydrogen concentration of an AAC cake during the rising and setting processes
Loading...
Dr. Martin Haas is a qualified physicist and holds a doctorate in Electrical Engineering. He has 30 years of experience in the field of AAC and calcium silicates. Starting in 1994 as a scientist in the YTONG R&D centre, he held numerous technical leadership positions in science, quality, and operational management. Since January 2021 he has been Director of Research and Development of H+H.
mhaas@hplush.de
Often it is necessary to watch the behaviour of an AAC cake during the rising and setting processes. For instance, when new mix recipes are developed or quality problems like rising cracks or collapsed cakes occur. In former times it was possible to stay next to the mould in the rising and setting area and measure the rising height with a ruler and detect the cake temperature with a thermometer. The point in time when the mass becomes gas-permeable and the blow-out craters appear was determined by observation. Nowadays, in most factories this area is protected with security fences, and it is often not possible to occupy the area for several hours. In addition, it is dangerous and hot in this area. For this reason, a measurement system was developed, which allows the recording of this information automatically and storing the data for later analysis. In this context, the measurement of the hydrogen development, especially the detection of the point in time of the blow-out was of special interest.
The measurement system
For the development it was important that the system should be easy to handle, robust and able to withstand ambient temperatures of up to 60 – 70°C. The heart of the system is a 32-bit microcontroller from the Arduino Uno R4 family. As explained later, the signal correction of the hydrogen sensor requires some computational power, which exceeds the capabilities of the smaller members of this microcontroller family. Figure 1 shows a block diagram of the measurement system.
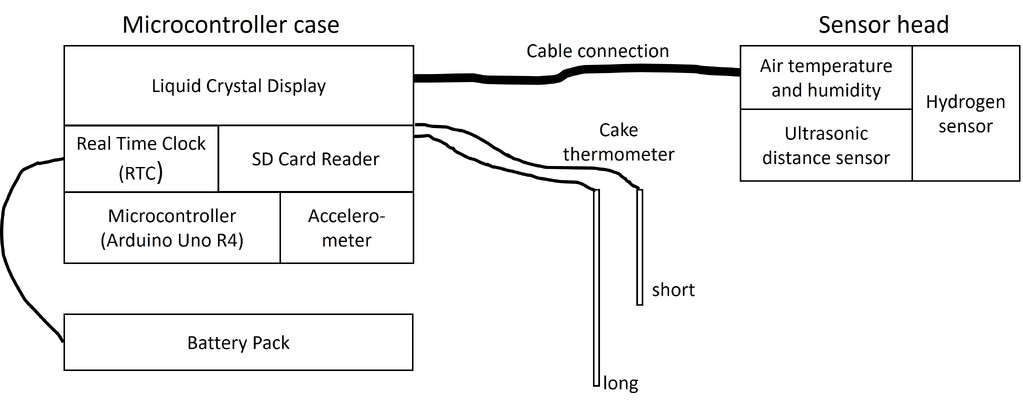
The microcontroller case
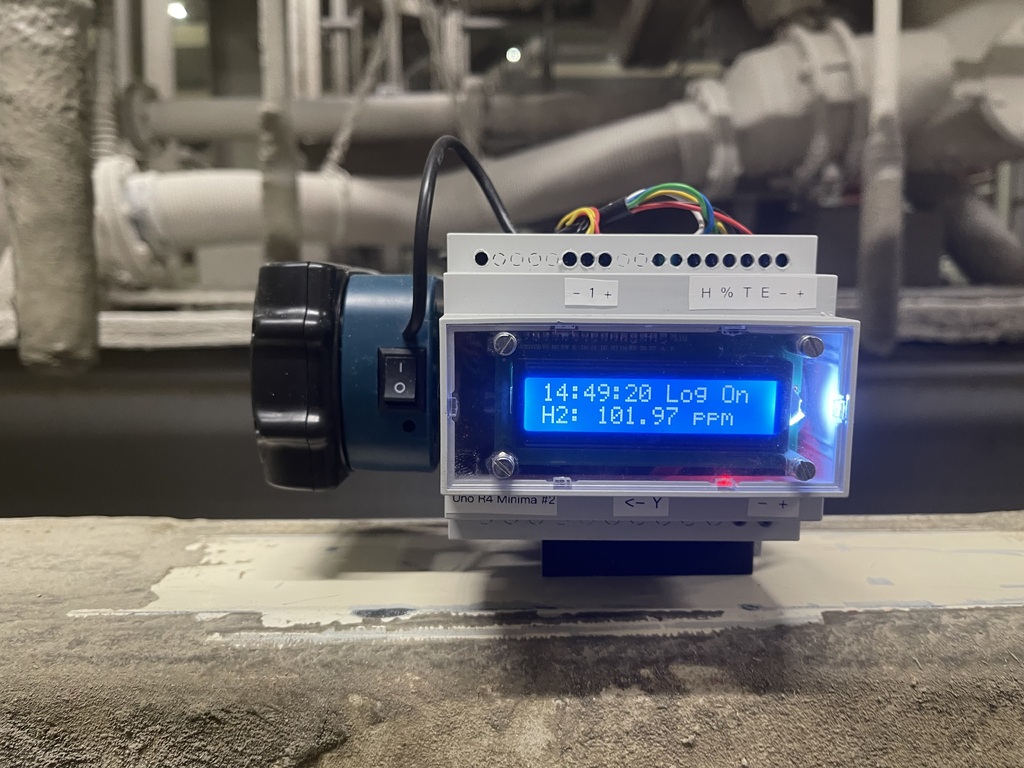
Figure 2 shows the case, which can be mounted on a 35 mm DIN mounting rail. It contains the following components:
· The Arduino microcontroller – This controller interfaces via its analogue and digital inputs with the sensors and performs all the calculation and data logging. The software development for this controller is done via Visual Studio with a VS micro extension.
· The accelerometer – This unit is based on a MPU 6050 chip [2] and contains a 3-axis accelerometer and a 3-axis gyroscope. It communicates with the microcontroller via the I2C protocol [1]. The accelerometer is used to detect movements of the cake. Sometimes this information is helpful to analyse and explain the behaviour and strange results of the other sensors, for example when the rising height periodically changes because the mould is vibrated or the hydrogen concentration changes rapidly because the mould enters or leaves the rising chamber.
· The real time clock – normally, microprocessors do not have an internal clock. This unit, which is mounted together with the SD card reader on a so-called “Arduino-Shield” delivers a battery buffered time for the data logger.
· SD Card reader – This module contains the SD card on which the measurement values are stored in a CSV file. The data can be analysed later with separate tools like MS Excel. The microcontroller is programmed in such a way that a dataset with all the measurement values is written to the file in 10-second intervals. This time interval is considered the optimum for the task at hand. However, the controller can programme any interval as required.
· Liquid Crystal Display – This unit shows the actual measurement values from the sensors. In intervals of 2 seconds, another sensor value is shown. It is also used to check whether the data logging is active or not. The communication between the microcontroller and the LCD is also done via the I2C interface.
· Start/Stop button – Not shown in Figure 1 is a button which starts and stops the data logging.
· Battery pack – The whole system is operated by an external battery pack. The input voltage can range from 7 to 24 V. The battery lifetime depends on the capacity of the accumulator-pack. At 18 V, the energy consumption is about 100 mA. With a 2Ah Li-Ion battery, recording intervals up to 15 hours and more are possible.
The sensor head
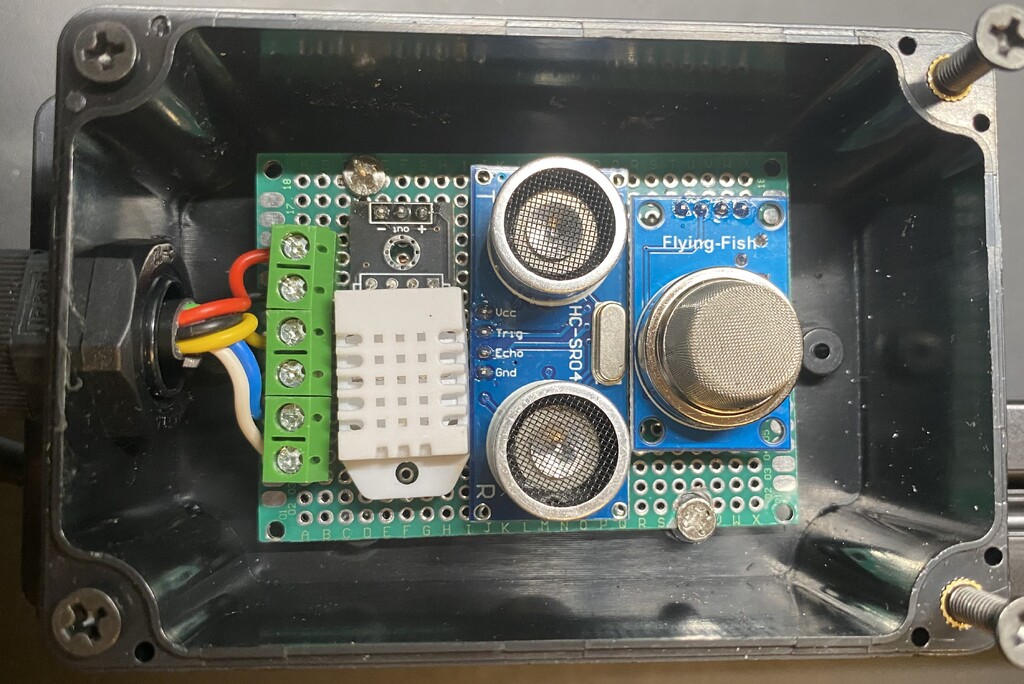
Protected in an open case (Fig. 3) are 3 or 4 sensors:
· HC-SR04 Ultrasonic distance sensor [3] – This module measures distances between 2 and 400 cm with a resolution of approx. 3 mm, which is sufficient for this application. The distance values must be calculated into a rising height of the AAC cake when doing the subsequent analysis in MS Excel. There are several programming libraries available for connecting this sensor with an Arduino microcontroller.
· To correct the influence of the air temperature to the speed of sound and therefore to the distance measurement, the value of the air temperature close to the sensor must be known. For this the following sensor is required:
· DHT 22 air temperature and humidity sensor [4] – This unit contains two sensors: An air temperature and an air humidity sensor. An 8-bit single chip computer sends calibrated sensor data to its digital interface. There are software libraries available to communicate with the Arduino. The measurement range of the thermometer is indicated as -40 to 80°C and the accuracy as ± 0.5°C. The humidity sensor has a measurement range of 0 to 100% RH with an accuracy of ± 2%.
· The values of this sensor are needed to compensate the cross sensitivities of the hydrogen sensors against temperature and humidity. How to do this, is explained below.
· The MQ-8 hydrogen sensor [5] – An SnO2 layer on a heated ceramic plate changes its electrical conductivity when exposed to hydrogen gas. The manufacturer provides a sensitivity curve with double logarithmic scale and the ratio of the actual resistance to a calibration value at 1000 ppm. Additionally, this sensor is also sensitive to temperature and humidity. To compensate for these effects, some mathematical operations must be done to calculate the electrical resistance of the sensor into a ppm concentration of hydrogen. This is shown in a later section.
The cake thermometers
The cake thermometers are an own construction. They are based on a Dallas DS18B20 digital temperature sensor. The sensor is mounted in a waterproof, cylindrical stainless-steel housing of 6 x 30 mm. The data is transmitted via the 1-wire protocol [6]. These sensors are delivered with different cable length. Due to the 1-wire protocol, only 3 wires are needed: GND, VCC and data. Each sensor has a unique 64-bit address. Several sensors can be connected in parallel to the same digital input of the microcontroller.
· The temperature measuring range is from -55 to 125°C.
· The accuracy is ± 0.5°C, which is sufficient for the application under consideration.
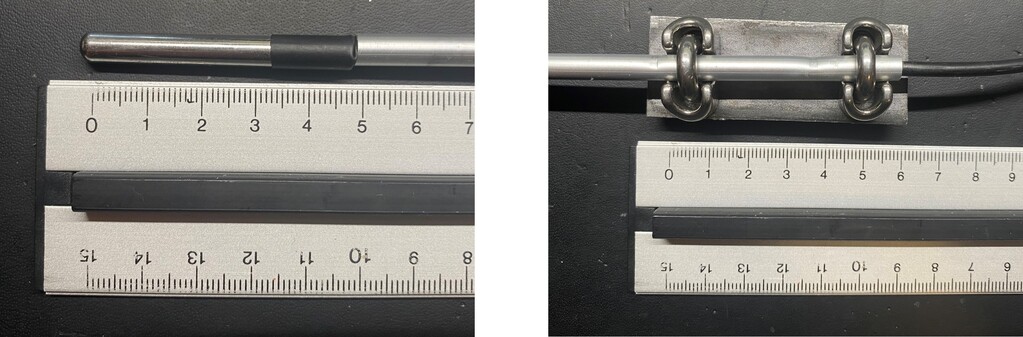
To use these sensors as cake thermometers in different depth of the AAC mass, aluminium pipes are used (Fig. 4). These pipes have an outer diameter of 6 mm and an inner diameter of 3 mm. At the end, where the sensor is attached, the inner diameter is enlarged to 4.5 mm. The sensor cable continues through the pipe. To adapt these thermometers to different dimensions of the moulds, the aluminium pipes can be shortened to any length.
The aluminium pipes are mounted on a 60 x 30 mm steel plate. Through this, the thermometers can be fixed to the mechanical construction via magnets, which allows easy retrieval from the cake after the measurement. Normally, two thermometers are used. One thermometer is long enough to be inserted into the mass immediately after casting, the other one should be positioned around the centre of the expected rising height of the cake.
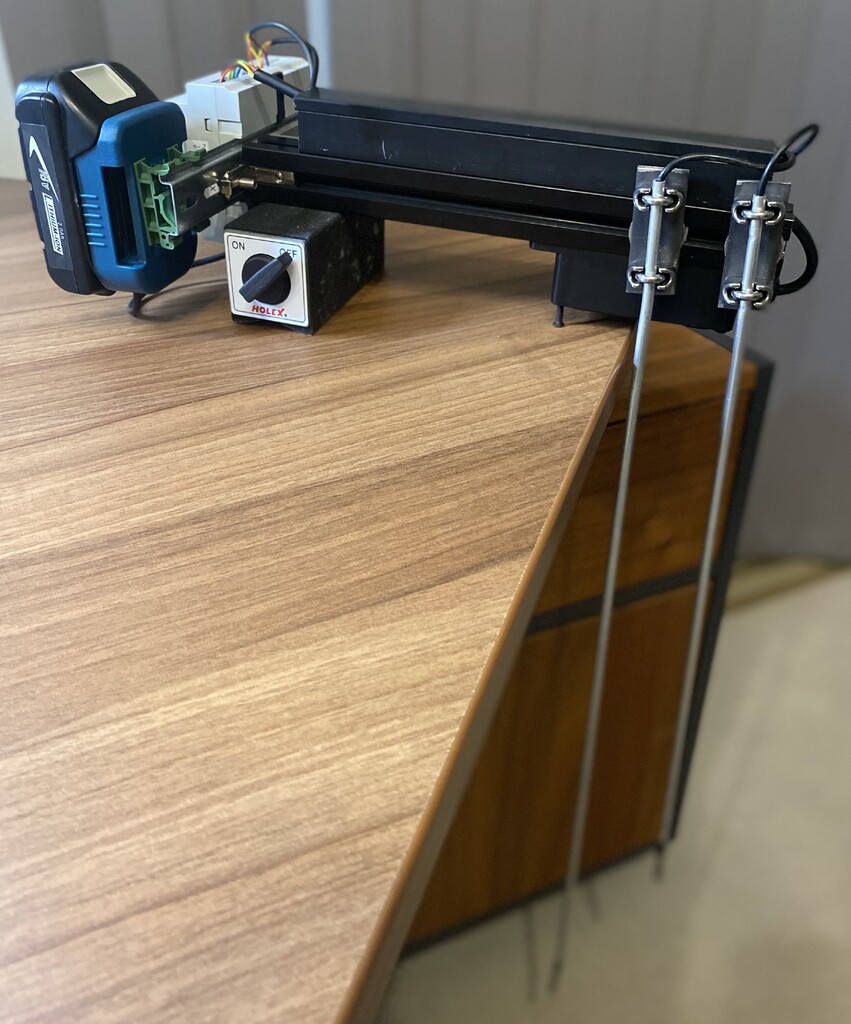
The mechanical construction
Microcontroller housing, sensor head, battery pack and cake thermometers are mounted on a 30 x 30 mm aluminium profile. The profile itself is mounted on a switchable magnetic base (Fig. 5). In this way, the whole construction can be easily fixed on the mould. The system is intended to be mounted on the mould before casting. The idea behind the system can be summarized as follows:
1. The ultrasonic sensor measures the distance to the bottom of the empty mould. With this information, the rising height can subsequently be calculated.
2. Casting height and casting temperature can also be measured.
3. The casting time can be determined with the information above.
The length of the 30 x 30 mm aluminium profile must be adapted to plant-specific needs. For example, it needs to consider if the mixer outlet or vibrating bottles are obstructing the path.
The hydrogen sensor
The MQ-8 hydrogen sensor is widely used as a gas alarm or a portable gas detector. However, like many other gas sensors it has some drawbacks such as a non-linear sensitivity curve or cross sensitivities against other gases, humidity, and temperature. While the cross sensitivity to other gases can be neglected in our case, the sensitivity against humidity and temperature must be considered and corrected by a computer algorithm to ensure that the signal from the sensor is not caused by changes in temperature and/or humidity. In the next sections, the calculation of the hydrogen concentration from the resistance of the sensor and the correction of the cross sensitivity is described.
Calculation of the hydrogen concentration from the sensitivity curve
The data of the sensitivity curve is derived from the supplier’s manual [5]. It is expressed in a double logarithmic format. The ordinate shows the ratio between the measured resistance (Rs) and the resistance at 1000 ppm (R0).
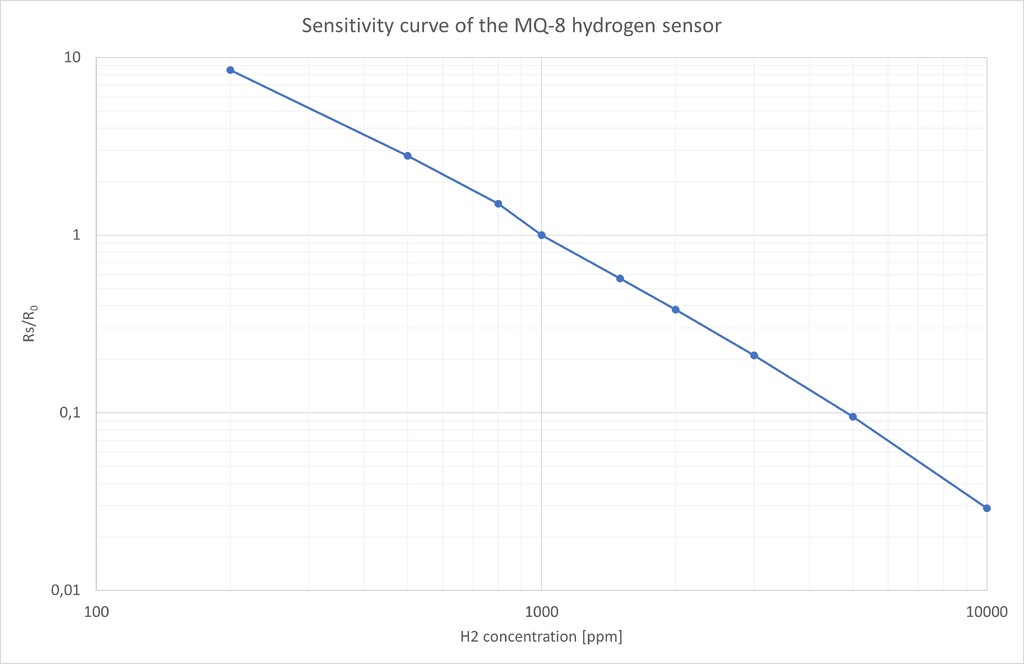
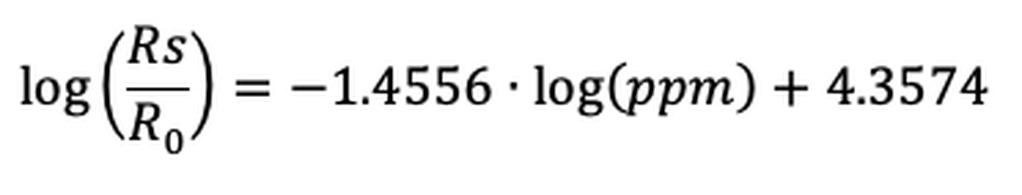
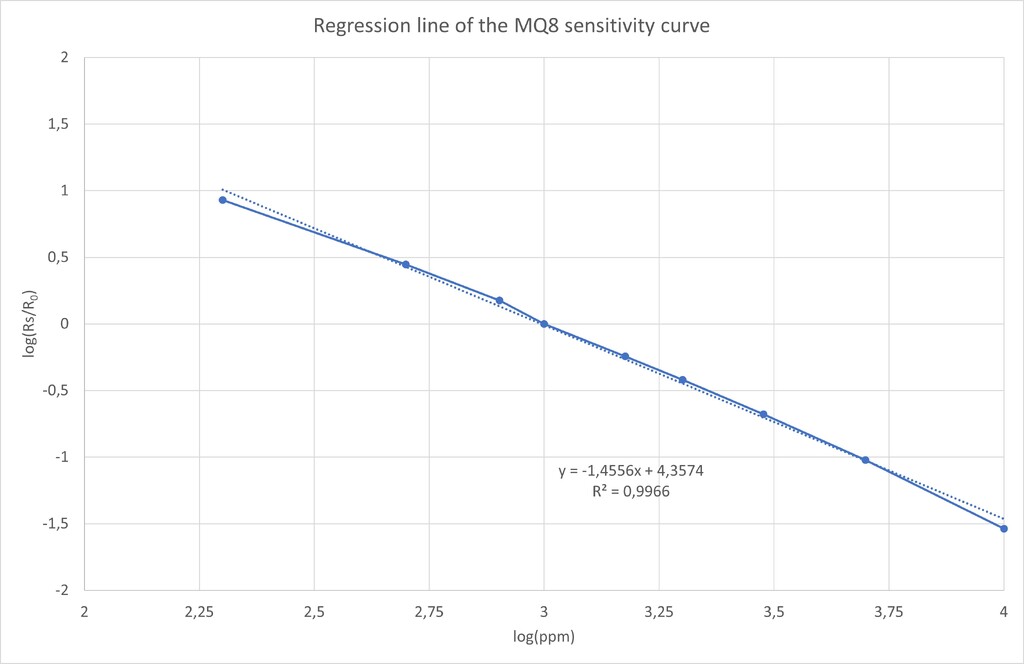
Using the data shown in Figure 6, the logarithm of the ppm concentration and the logarithm of the Rs/R0 ratio are calculated. The results are displayed in a chart and a regression line is calculated in MS Excel to obtain the relationship as a liner equation (Fig. 7):
R0 must be determined in a separate calibration process. As we do not have a gas calibration system providing a hydrogen concentration of 1000 ppm, we use a different method to calibrate the sensor in clean air.
Calibrating the sensor in clean air
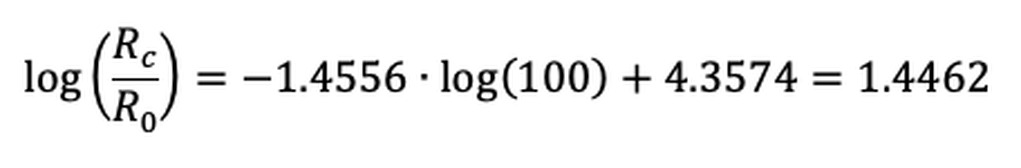
The coefficients of the regression line can be used to calculate R0 with resistance data obtained in clean air (Rc). As the logarithm of 0 is not defined, it is assumed, for simplicity, that clean air has a H2 concentration of 100 ppm, based on the manufacturer’s declared detecting concentration range of 100 – 10000 ppm. This results in the following equation:
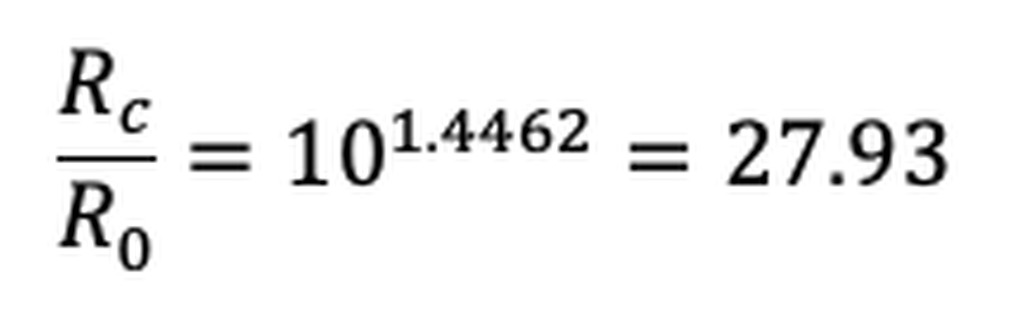
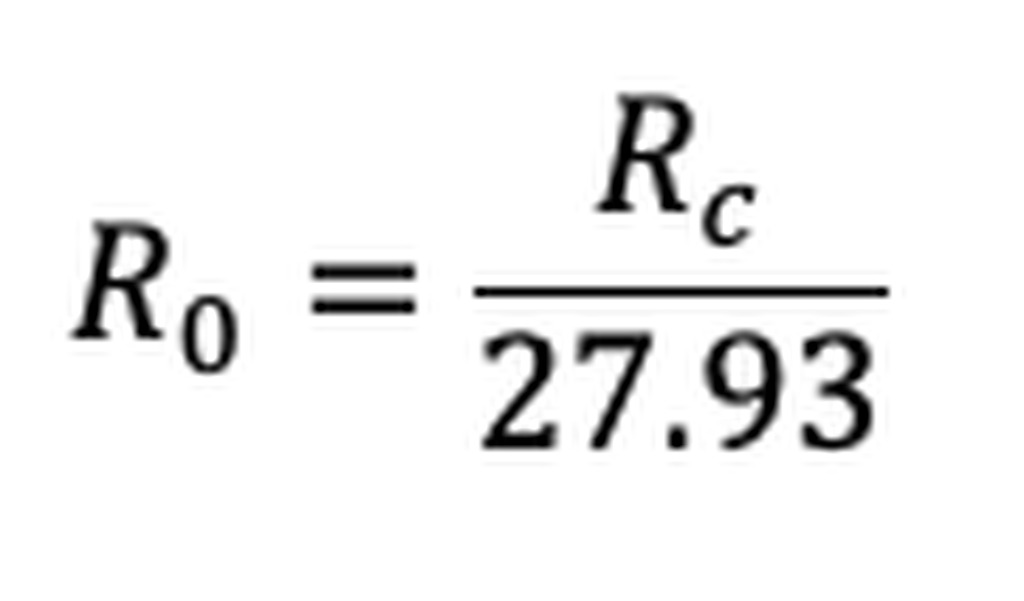
Consequently, a conversion factor between Rc and R0 is obtained:
To determine the resistance Rc, the measurement system must be switched on in a clean atmosphere. During the setup process of the microcontroller, the resistance of the hydrogen sensor is measured for a period of 20 seconds and the average value is taken as Rc. R0 is then calculated using the conversion factor above.
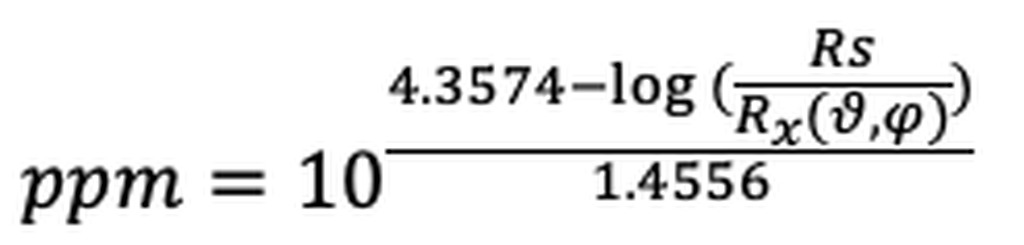
The ppm concentration can subsequently be calculated from the sensor resistance, using the coefficients of the regression line:
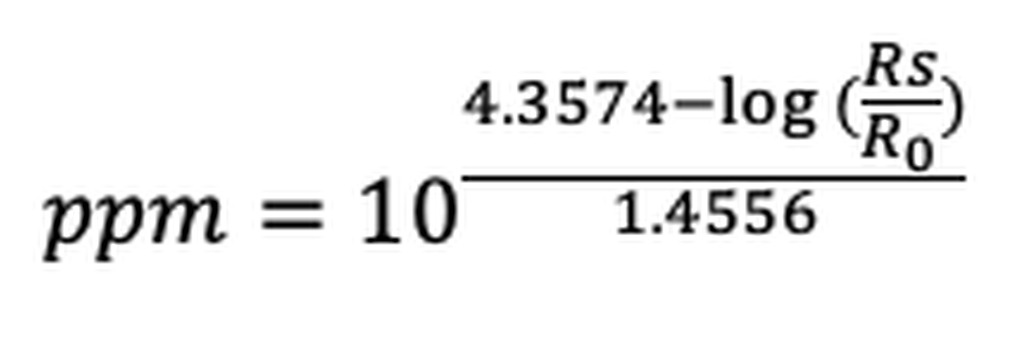
· Rs is the actual resistance of the MQ-8 hydrogen sensor.
· R0 is the resistance at 1000 ppm, determined during the setup process of the microcontroller.
Correcting the cross-sensitivity data to temperature and humidity
The cross-sensitivity data is derived from the manual of another manufacturer [7]. The behaviour of the hydrogen sensor in an atmosphere of 1000 ppm hydrogen under different temperatures and humidity values is shown in Figure 8.
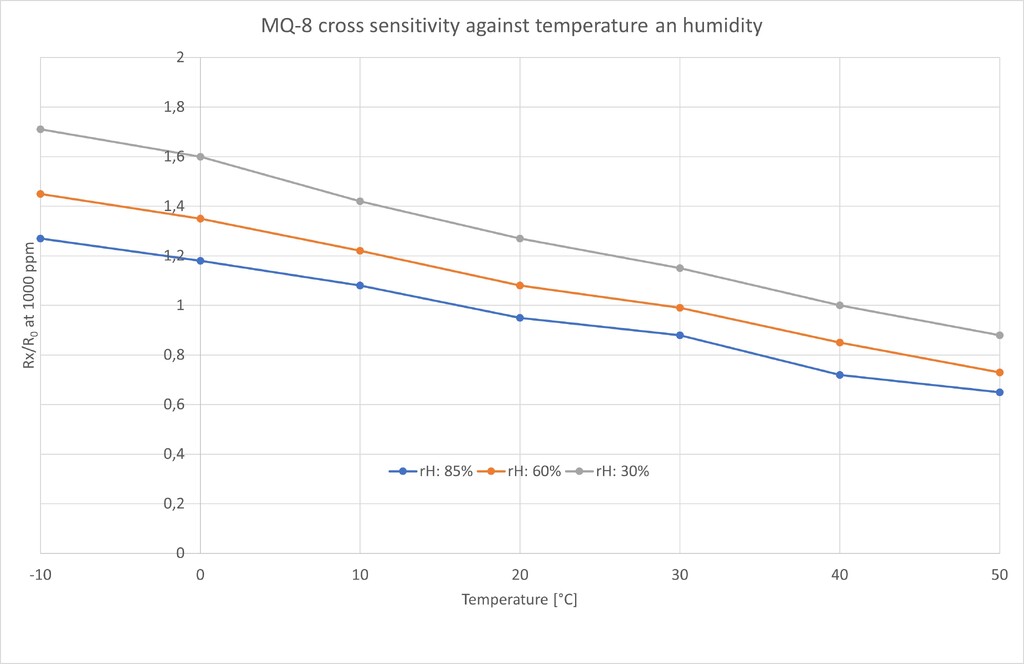
To calculate the influence of temperature and humidity on R0, a multiple regression analysis was performed with the statistical software “Mintab” [8], using the data shown in Figure 8. The following correlation equation was obtained:
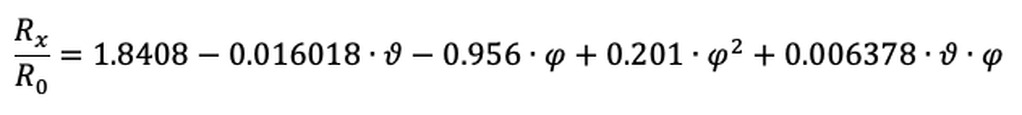
Where:
υ is the ambient temperature,
φ is the relative humidity,
Rx is the MQ-8 resistance at 1000 ppm at the given temperature and humidity,
R0 is the MQ-8 resistance at 25°C and 55% RH, which was calculated during setup of the microcontroller.
Instead of R0, Rx(υ,φ) is now used as the reference resistance at 1000 ppm at given temperature and humidity.

The equation to calculate the hydrogen concentration in ppm from the MQ-8 resistance is as follows:
Measurement results
The next sections summarize results of rising and setting measurements obtained with this tool in different H+H factories. The complete rising and setting processes between casting and cutting are recorded, however some graphs show only the first 60 minutes, as this is the period that is most interesting.
Plant 1: Factory with a closed rising chamber for 24 moulds
Figure 9 shows one of the first measurement results obtained with this tool. The factory operates a total of 36 rising and setting areas split up into 6 rails of 6 moulds each, which are arranged in sequence. The first position on the rail is an open chamber with a ceiling height of approx. 2 meters. Positions 2 to 5 are situated in the closed rising chamber with a ceiling height of approx. 1.5 meters. Position 6 is in an open space below the tilting crane. This information is important to understand the measurement results, which are explained in detail below.
The following numbers correspond to the numbered stars in Figure 9:
1. The casting height was 24.5 cm and the casting temperature corresponded to 34°C. This information is derived directly from the recorded data and not from the graphical presentation.
2. The factory uses 60% of fine and 40% of coarse aluminium for this mix recipe. The fine aluminium causes a rapid increase in rising height, which is followed by a smaller gradient caused by the coarse aluminium.
3. The sudden increase of the hydrogen concentration is not caused by the blow-out of the cake, but by the fact that the mould is moved from the open space into the closed rising chamber, which already contains other moulds. This can be detected by the simultaneous acceleration and a small reduction in ambient humidity caused by air draft.
4. The mould is moved to the next rising position. The variation of the hydrogen concentration is caused by the movement through the air, which can also be detected through the variation in ambient humidity.
5. At the point of the maximum rising height, a peak in the hydrogen concentration is observed. However, this peak is blurred by the hydrogen development of the other cakes. The blowout occurs after 48 minutes.
6. The mould is moved to the next position, which can be concluded from the acceleration peak. The two peaks of the hydrogen concentration between 6 and 7 may be caused by other cakes that are blowing out.
7. Movement of the mould and a change in the hydrogen concentration caused by the air draft.
8. The maximum rising height at Position 5 was 67 cm. The final rising height was 66 cm, which corresponds to a collapse of the cake by 1 cm.
9. The mould is leaving the closed rising chamber and immediately the hydrogen concentration drops.
The total rising and setting duration was 3 hours, but the tool had to be removed earlier to avoid a collision with the tilting crane.
Plant 2: Factory with 9 separate rising chambers with 4 moulds each
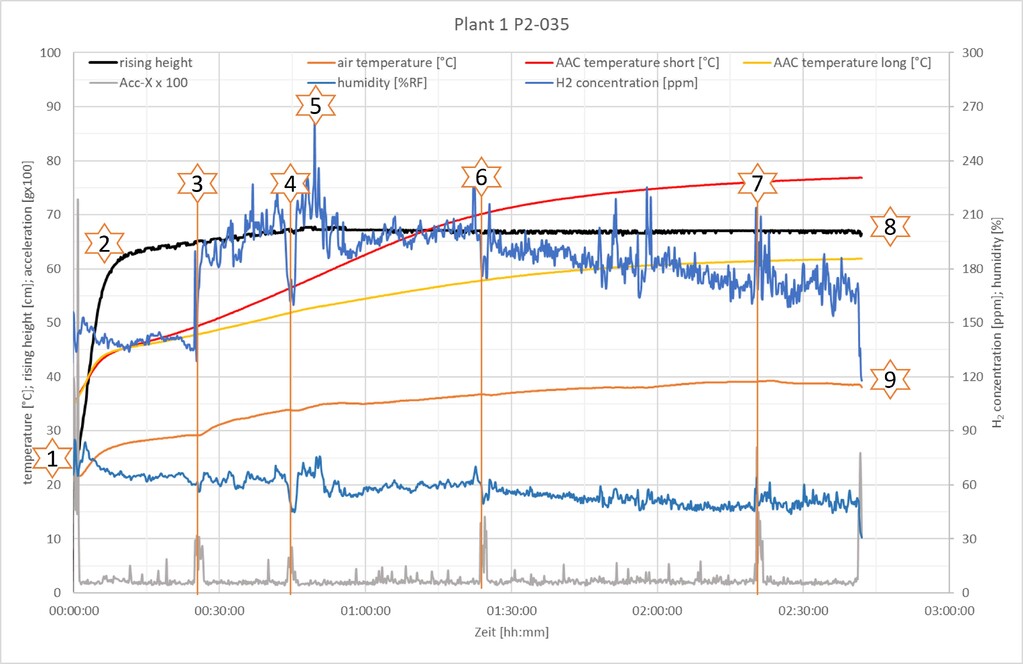
Figure 10 shows the measurement results of the same product as in Figure 9 (P2-035) but in another factory. This factory is based on Durox technology with horizontal cutting and moulds having a height of 90 cm. The target rising height of 76 cm is 8 - 10 cm higher than that in the factory of Figure 9. The idea behind this is to avoid the so called “Calsilox-cracks” at the cross cutter, which occur when the cutting wires leave the AAC cake. Figure 10 shows the measurement results for the first 60 minutes, obtained on a trial mix.
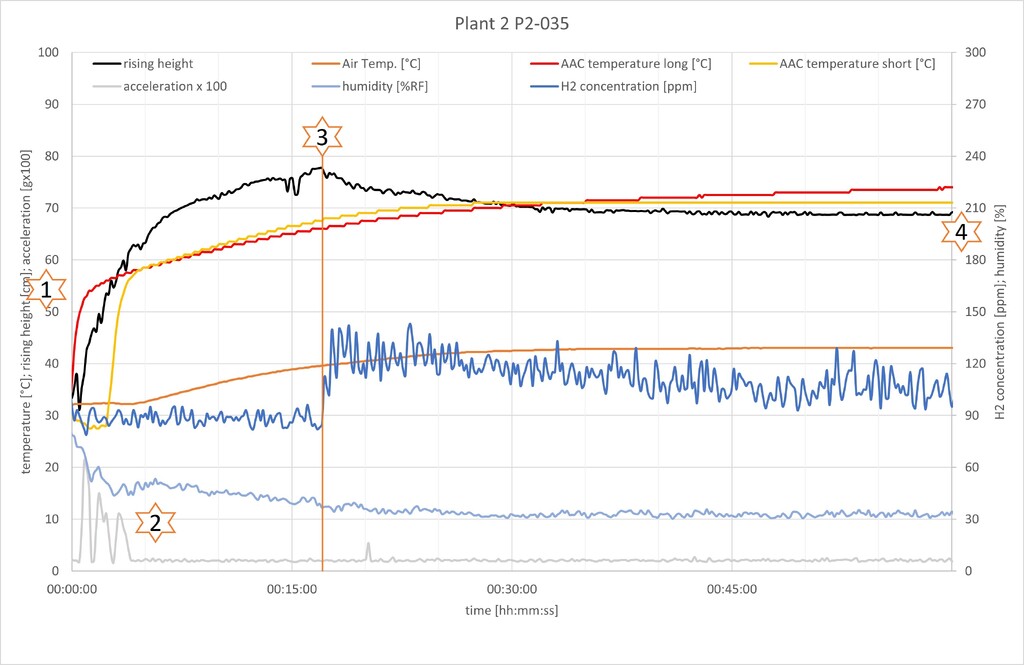
The following numbers correspond to the numbered stars in Figure 10:
1. The casting temperature is 53°C and the casting height is 33 cm. These values can be directly derived from recorded data. The exact determination of this values is difficult, as the casting process lasts for 1 – 2 minutes. This time is characterised by a continuous increase in height and temperature.
2. The acceleration at the beginning is caused by the vibration bottles at the mixer outlet and the movements of the sliding platform, which inserts the mould into the rising chamber, where it remains without any further movement until it is picked up again to be forwarded to the cutting process.
3. When the maximum rising height of 78 cm is measured, there is a sudden increase in the hydrogen concentration. For this test, no other moulds were placed in the rising chamber, which means that the increased hydrogen reaction of the entire rising and setting process is caused by this mould only. The point in time when the blow-out was detected and the maximum rising height occurred was 17 minutes. For this mix recipe, only fine aluminium was used. Together with the high casting temperature this explains the fast increase in rising and the early blow-out time. Immediately after reaching the maximum rising height, collapse of the cake was observed. Obviously, the cement reaction had not reached a sufficiently advanced stage at this point and the stiffening of the cake was insufficient for retaining the height of the cake.
4. The final rising height was 69 cm, which means that the cake was collapsing by 9 cm. As a result, the raw density of the product was too high.
Plant 2 with an optimized recipe
The test shown in Figure 10 revealed that the rate of the aluminium reaction had to be lowered. Therefore, the casting temperature was reduced and 10% of coarse aluminium was added. The result is shown in Figure 11.
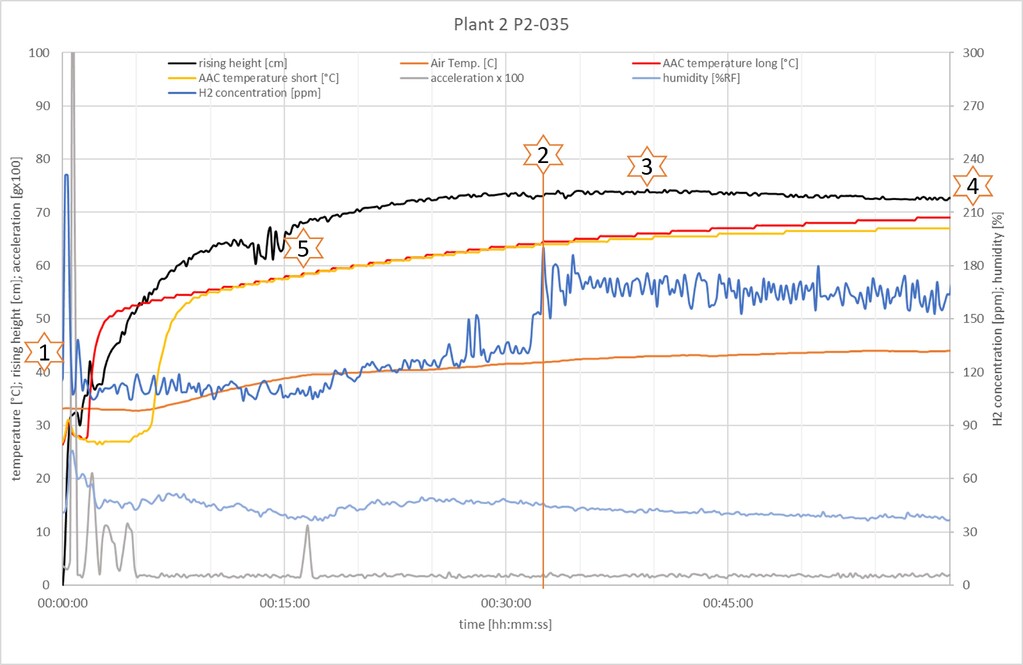
The following numbers correspond to the numbered stars in Figure 11:
1. The casting temperature was 48°C and the casting height was 35 cm. As explained earlier, the determination of casting height and casting temperature is not very accurate due to the duration of the casting process of more than 1 minute.
2. The blow-out was detected after 32 minutes at a rising height of 73 cm.
3. The maximum rising height with 74 cm was achieved after 39 minutes. Some rising cracks could be observed at the cutting line afterwards.
4. The final rising height was 72 cm, which corresponds to a collapse of 2 cm.
5. No satisfying explanation for the periodical change of the rising height at this time could be derived, because the movement detected by the accelerometer occurred a few minutes later.
This test showed that the reduction of the casting temperature and the addition of coarse aluminium reduced the collapsing of the cake. As a countermeasure against the rising cracks, either the aluminium reaction could be accelerated (e.g. by a higher casting temperature) or the stiffening of the cement could be retarded (e.g. by the addition of water), with the risk that the green strength for cutting could not be reached in the given time. In any case, the measurement results of this tool are extremely helpful do discuss and decide the next steps in a mix recipe optimization process.
Measurement results of the hydrogen concentration
In the simplest case, it would be sufficient to measure only the change of the electrical conductivity of the hydrogen sensor to detect the blow-out. For this purpose, it is not necessary to determine the exact H2 concentration. However, the intention was to investigate the hydrogen concentration in different types of rising chambers. The highest concentration measured so far is in the region of 250 – 300 ppm in a tiny rising chamber with low ceiling height.
According to [9] and [10] the flammability limit of hydrogen in air is between 4% and 74%, and the explosion limit lies between 18.3% and 59.0%. 4% correspond to a concentration of 40000 ppm. This is far from the concentrations measured in this project.
According to [11], no official warning limit for hydrogen concentration exists. Usually, 10% of the lower explosion limit (LEL) are taken for flammable gases as a warning limit. For hydrogen, the lower flammable limit of 4% is taken as the lower explosion limit. 10% of the LEL of 4% correspond to a concentration of 4000 ppm. This value is in the measurement range of the developed gas sensor.
Conclusions
The measurement tool discussed in this article provides interesting insights in the behaviour of an AAC recipe during the rising and setting process. Especially the point in time when the AAC mass becomes gas-permeable and the blow-out craters appear is very critical and can now be monitored without having manpower present inside a security area. The data obtained in this way is very valuable when error detection and recipe optimization are of special interest. However, interpreting the data still requires the knowledge and experience of an AAC expert.
References
[1] Anonymous, I²C, Wikipedia article, https://en.wikipedia.org/wiki/I%C2%B2C
[2] Anonymous, MPU-6000 and MPU-6050 Product Specification Revision 3.4 https://invensense.tdk.com/wp-content/uploads/2015/02/MPU-6000-Datasheet1.pdf
[3] Anonymous Ultrasonic Ranging Module HC - SR04, https://cdn.sparkfun.com/datasheets/Sensors/Proximity/HCSR04.pdf
[4] Anonymous, Digital-output relative humidity & temperature sensor/module, https://www.sparkfun.com/datasheets/Sensors/Temperature/DHT22.pdf
[5] Hanwei Electronics Co.,Ltd, Technical data MQ-8 gas sensor, http://hwsensor.com
[6] Anonymous, Overview of 1-Wire Technology and Its Use, https://www.analog.com/en/resources/technical-articles/guide-to-1wire-communication.html
[7] Zhengzhou Winsen Electronics Technology Co., Ltd, Flammable Gas Sensor (Model: MQ-8) Manual. Version 1.3, 2014
[9] Office of Energy Efficiency and Renewable Energy - Hydrogen Safety, https://www1.eere.energy.gov/hydrogenandfuelcells/pdfs/h2_safety_fsheet.pdf
[10] Arizona State University, Safe engineering Hydrogen Gas, https://safe.engineering.asu.edu/hydrogen-gas
[11] Berufsgenossenschaft Rohstoffe und chemische Industrie, Auf welche Werte sind die Alarmschwellen von Gaswarngeräten mit einer Messfunktion für den Explosionsschutz einzustellen?, https://www.bgrci.de/exinfode/ex-schutz-wissen/antworten-auf-haeufig-gestellte-fragen/mess-und-warngeraete/23-auf-welche-werte-sind-die-alarmschwellen-von-gaswarngeraeten-mit-einer-messfunktion-fuer-den-explosionsschutz-einzustellen, 2024