Science & Innovation
Properties, Microstructure and Environmental Impact
Substituting Quartz with Volcanic Tuff Ash in Autoclaved Aerated Concrete
Loading...
Professor Chen Wei is a National High-Level Talent and Distinguished Professor serving as the Executive Deputy Director of the State Key Lab of Silicate Materials for Architectures at Wuhan University of Technology. His research focuses on eco-building materials and safety assurance materials.

Dr. Yuan Bo is an Associate Professor at the School of Materials Science and Engineering, Wuhan University of Technology. His research focuses on calcium carbonate functional materials, eco-building materials, and novel cementitious materials for mining applications.

Chris Straub studied mineralogy at the Martin-Luther-University in Halle (Saale), Germany, and was working together with the authors of this study within the framework of M2i and TU/e in the Netherlands as well as WHUT in China. He is currently the head of R&D at CSH Concept GmbH (Germany).

Prof. Dr. Jos Brouwers is a Full Professor and Chair of Building Materials at Eindhoven University of Technology (TU/e). He obtained his MSc in Mechanical Engineering and his PhD in Technical Sciences at TU/e. He has worked as Research engineer and project leader in the Department of Mechanical Engineering at Akzo Nobel Central Research and Associate professor in the Department of Civil Engineering (& Management) at Twente University of Technology, The Netherlands.
Jos is currently guest professor in the State Key Lab of Silicate Building Materials, at Wuhan University Technology, China, where he focuses on Construction Materials and Sustainable Building. In addition, he is an editorial board member of Vestnik, a peer-reviewed journal published by the Moscow State University of Civil Engineering, and a Member of the Consultative Board of Van Berlo Bedrijfsvloeren. Furthermore, Jos is a reviewer of project proposals for IWT (Swiss Institute for Materials Technology) and SNF (Dutch foundation for flexible housing standards).
The application of industrial by-products or waste material of such processes in cementitious materials has a long history. Already the original patent of AAC from 1925 highly recommends the implementation of those. In the current case the authors studied the application of TA from the Eifel mountains in Germany. This material was chosen due to its interesting combinations of properties. Tuff ash is locally widely spread and very easy to mine, it is located directly under the soil, and on top of the trass. Trass is a natural pozzolanic material used for example in trass cement (CEM II, CEM IV, CEM V, CEM VI).
The increased demand for energy reduction and resource reuse in construction materials is leading to a more sustainable development [1,2]. The construction industry, in general, has a high contribution to the global carbon emissions, as well [3,4]. AAC has the potential to become a crucial solution to this issue, with its well-known advantages over traditional concrete [5,6].
One of the challenges of AAC-production is the milling of the quartz sand, which dominates the energy consumption during the preparation [7].
The usage of various volcanic ashes in concrete has been widely studied [15-21], but the information about its application in AAC is surprisingly lacking. While the ashes with high pozzolanic properties are widely applied in ordinary cement and concrete, the ashes that have no, or reduced properties are very promising to enhance AAC.
This study investigates the use of TA as a quartz replacement in AAC production, aiming to reduce energy consumption associated with raw material preparation and decrease the overall environmental impacts of AAC. Employing a comprehensive methodological approach, this research encompasses material characterization, mix design, and performance evaluation of TA-based AAC. The experimental program includes the evaluation of fresh and hardened state properties, microstructure analysis, and examination of reaction products in AAC containing TA. Energy consumption analyses are conducted to quantify potential energy savings compared to traditional sand-based AAC production. This study has its focus on simulating the industrial production process. By trying to closely replicate the entire production process, from sample moulding to autoclaving and characterization, this study aims to provide practical insights and guidelines that can be directly applied to industrial-scale AAC production.
Materials and experiment
Materials
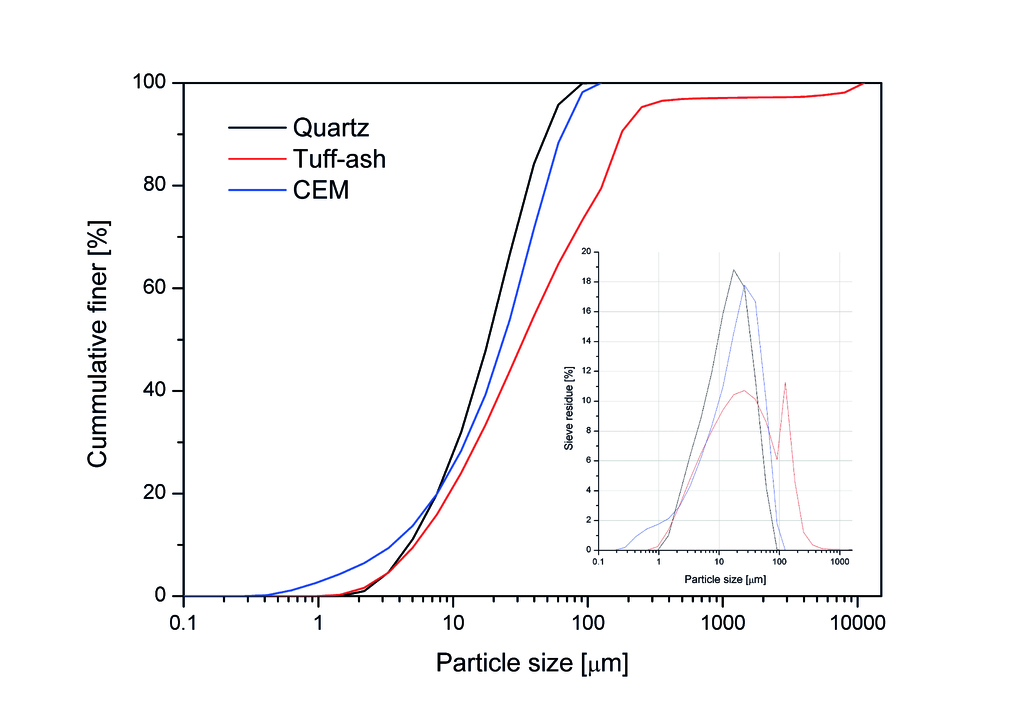
The sand-based reference recipe for the experiments was obtained from Hess AAC Systems B.V. The TA was provided by Trasswerke Meurin Produktions- und Handelsgesellschaft mbH, Andernach, Germany and grounded to fine particles before experiments. The chemical compositions of the raw materials, i.e. quartz, anhydrite, cement, portlandite, lime and TA, were determined by X-ray Fluorescence (XRF), as shown in Tab. 1. The particle size distributions of quartz, cement and TA are presented Fig. 1.
Table 1: Chemical compositions of the raw materials
Chemical compositions | Quartz | Anhydrite | Cement | Portlandite | Lime | Tuff ash |
Na2O + K2O | - | 0.46 | 1.18 | 0.03 | 0.17 | 10.00 |
MgO | - | 1.80 | 1.40 | 0.51 | 0.82 | 1.30 |
Al2O3 | 0.14 | 0.56 | 5.60 | 0.20 | 0.64 | 17.70 |
SiO2 | 99.5 | 2.10 | 20.60 | 0.48 | 1.20 | 59.70 |
SO3 | 0.01 | 41.90 | 5.00 | 0.07 | 0.05 | 0.08 |
CaO | - | 38.50 | 63.10 | 70.60 | 94.40 | 2.40 |
Fe2O3 | 0.03 | 0.19 | 2.10 | 0.21 | 0.03 | 4.40 |
L.O.I. | 0.14 | 3.08 | 2.00 | 27.40 | 2.50 | 2.70 |
Specific density [g/cm³] | 2.65 | 2.95 | 3.12 | 2.31 | 3.24 | 2.55 |
Blaine surface area [cm²/g] | 6070 | - | 3520 | - | 4270 | 2750 |
((Z)) Sample preparation
Fig. 2 and Tab. 2 show the preparation process of the AAC samples and the recipes of samples with different levels of TA. The quartz, TA and Ca(OH)2 were firstly mixed in water (45 °C) for about 2 min at a low speed, then the CaO, cement and anhydrite were added to the mixture and mixed for another 3 min. Meanwhile, the metallic Al powder was dispersed in the water (45 °C), and then added to the homogeneous mixture mixing for approximately 0.5 min before sampling. The cast samples were cured for 12 h before transferring to autoclave: 20 minutes of vacuum (-0.8 bar), heating to 187 °C / 11 bar over 1.5 hours, maintaining a plateau at 187 °C / 11 bar for 5 hours, and cooling to 20 °C / 0 bar within 1.5 hours.
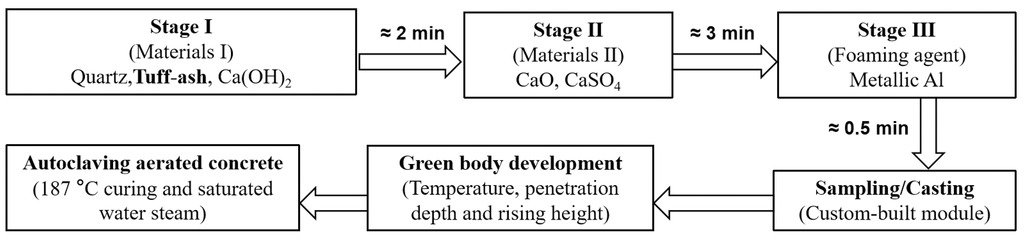
Table 2: Recipes of samples with different levels of TA.
Replacing levels | Reference | 20% | 40% | 60% | 80% | 100% |
CaO [kg] | 1 | 1 | 1 | 1 | 1 | 1 |
CEM [kg] | 2.4 | 2.4 | 2.4 | 2.4 | 2.4 | 2.4 |
Ca(OH)2 [kg] | 0.3 | 0.3 | 0.3 | 0.3 | 0.3 | 0.3 |
SiO2 [kg] | 8 | 6.4 | 4.8 | 3.2 | 1.6 | 0 |
Tuff Ash [kg] | 0 | 1.6 | 3.2 | 4.8 | 6.4 | 8 |
CaSO4 [kg] | 0.3 | 0.3 | 0.3 | 0.3 | 0.3 | 0.3 |
Al [g] | 10 | 10 | 10 | 10 | 10 | 10 |
Total solids [kg] | 12 | 12 | 12 | 12 | 12 | 12 |
W/P | 0.625 | 0.625 | 0.625 | 0.625 | 0.625 | 0.625 |
H2O [kg] | 7.5 | 7.5 | 7.5 | 7.5 | 7.5 | 7.5 |
Characterization
Green body development
To evaluate the flowability of the mixture, a cone test was performed (ring, Ø=7 cm, h= 6 cm). The cone was filled with the prepared mixture and then lifted vertically, allowing the slurry to spread on a glass plate. The diameter of the spread was measured and recorded to assess the flow properties of the mix.
Meanwhile, the slurry was poured into insulated moulds. A data logger was employed in the insulated moulds to monitor and record the temperature and rising behaviour of the mixture. The stiffening behaviour of the mix was investigated using a specialized indenter equipped with a pointy cone weighing 30 g.
The green strength σgreen is determined by a modified concrete penetrometer to assess if the green bodies are strong enough to be demoulded and can stand their own weight without being too strong to be cut by wire. The initial concrete penetrometer was calibrated in [psi] (1 psi ≈ 6895 Pa).
Hardened state analysis
AAC cubes with dimensions of 100×100×100 mm³ were prepared for the determination of raw density and compressive strength. The cubes were cut from the middle of the AAC-block and polished to achieve smooth surfaces and then oven-dried at 60 °C with forced ventilation until reaching a constant weight. After cooling to room temperature, the raw density and compressive strength of the samples were measured, following the guidelines specified in EN 771-4 and EN 771.
The thermal conductivity of the AAC samples was assessed using an ISOMET model 2104 device (Applied Precision). To ensure accurate measurements, multiple readings were taken on polished surfaces of the samples, providing a representative value of the thermal conductivity.
Scanning Electron Microscopy (SEM) was employed to study the microstructure and morphology of the AAC samples. Broken samples were prepared and analysed using SEM to gain insights into the microscopic features of the material. For the phase analysis X-Ray Diffraction (XRD) measurements were carried out.
The drying shrinkage of the AAC samples were measured following the procedure as suggested by RILEM AAC5.2.
Results
TA and its effects on spread flow
Fig. 3 shows the role of TA on the workability of AAC, which illuminate that the TA had a minimal impact on the spread flow, with all samples falling within the AAC target range (25 ± 3 cm, based on previous research [8]) at the constant water to solid ratio of 0.625. The slightly increased spread flow of sample with 60% TA could possibly be caused by the optimization of the grading line. Though the SEM image of TA reveals a porous and irregular particle structure, the replacement of quartz by TA, even at high levels, does not significantly alter the flowability of the AAC mixture. This phenomenon can be attributed to the similar particle size distribution and specific surface area of TA (2750 cm²/g) and quartz powder (2660 cm²/g).
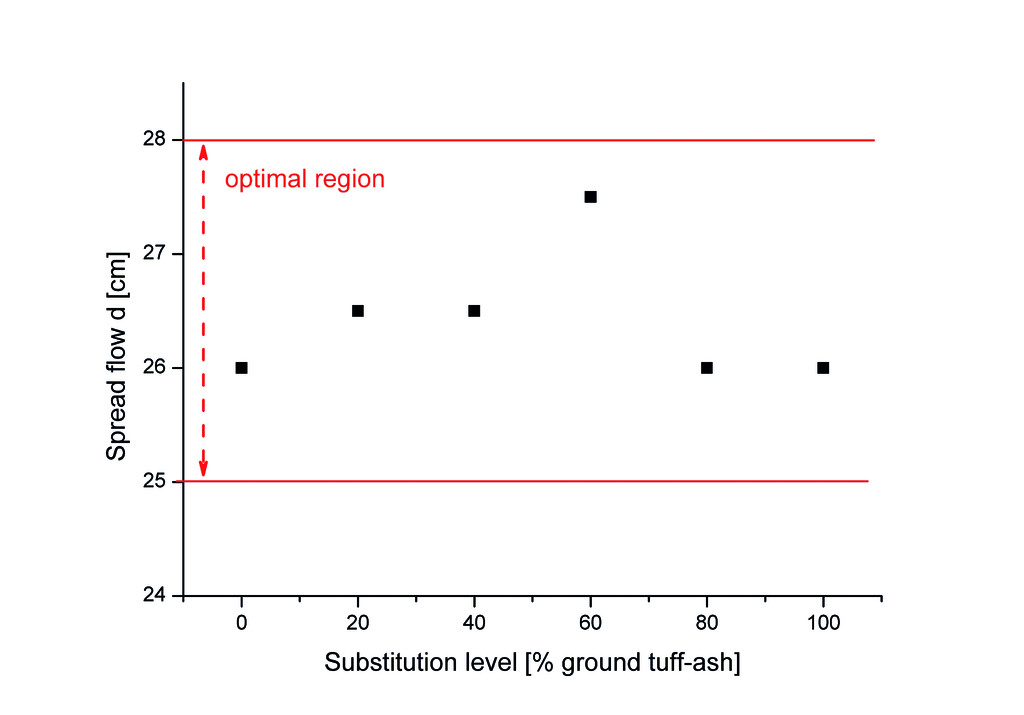
Different from the production of ordinary concrete, where the water-to-solid ratio primarily influences the strength development, the water-to-solid ratio in AAC mainly affects the viscosity of the mixture and the pore size and distribution. Therefore, maintaining the appropriate water-to-solid ratio is crucial for achieving the desired flowability and pore structure in AAC. The minimal variation in spread flow values across different TA replacement levels indicates that TA can be used as a sustainable alternative to quartz in AAC production without compromising the rheological properties of the mixture.
Green body development
Fig. 4a presents the setup for measuring the temperature, penetration depth, and rising height of AAC samples containing different levels of TA. These parameters provide valuable insights into the hydration kinetics, setting behaviour, and pore structure development of the AAC green body. As shown in Fig. 4c, the temperature evolution of the AAC mixtures is significantly influenced by the TA content: higher substitution levels accelerate hydration, leading to faster temperature rises and higher peaks. The 100% TA sample reaches 83.2 °C (782 min), compared to 78.3 °C (280 min) for the reference. Samples with 80% and 100% TA also display a secondary hydration peak, possibly linked to delayed TA reactions or phase transformations.
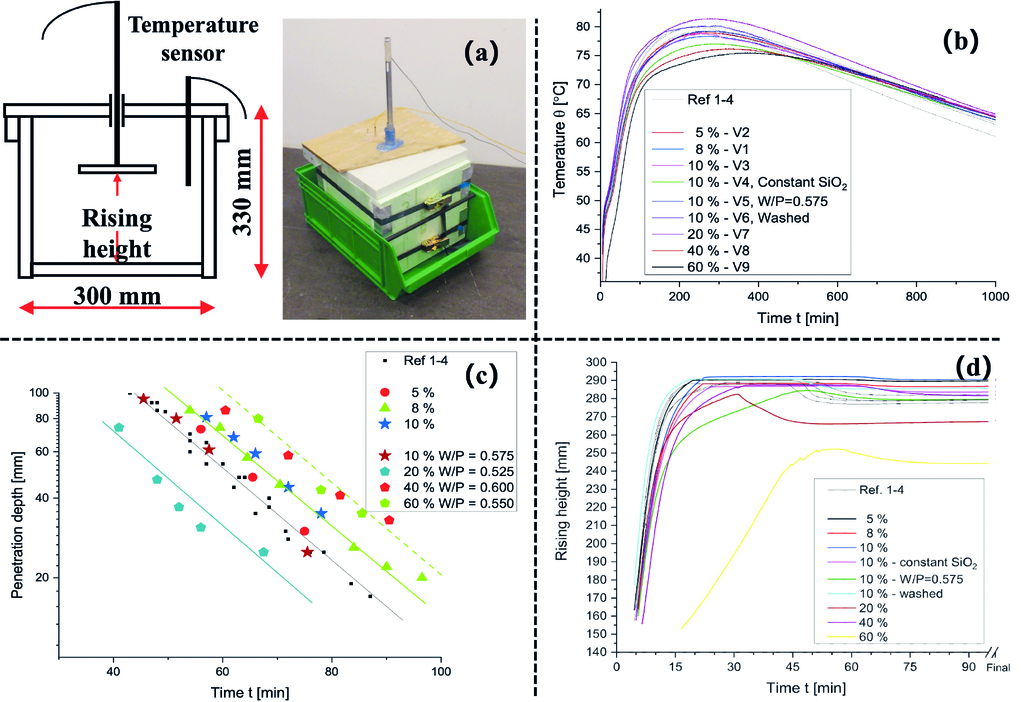
Increasing TA accelerates hydration and setting of the green body. As shown in Fig. 4d, the penetration curve of the 100% TA sample resembles the reference but stiffens 22–25 min earlier, due to rapid hydration product formation. Rising height curves (Fig. 4b) confirm faster pore structure development, with TA mixtures quickly reaching the maximum detectable height. All samples exhibit a typical curve: steep rise, slight drop, then plateau. The drop reflects pore structure settling, caused by the mismatch between setting and pore formation from aluminium powder. The reference shows the strongest drop, while TA mixtures – with faster setting – stabilize the matrix earlier and thus retain pore height better.
The enhanced hydration kinetics, heat release, and setting with TA result mainly from its higher reactive SiO₂ content and glassy silicate phases. This accelerates solid matrix and pore structure formation, improving stability and strength of the AAC green body.
Mechanical performance and pore structure of hardened samples
Fig. 5 illustrates the relationship between compressive strength and TA substitution level in AAC samples. The compressive strength initially increases with TA content, peaking at 3.6 MPa with 20% substitution. However, substitution levels exceeding 40% lead to a gradual strength decrease, with 100% TA samples exhibiting 2.8 MPa strength.
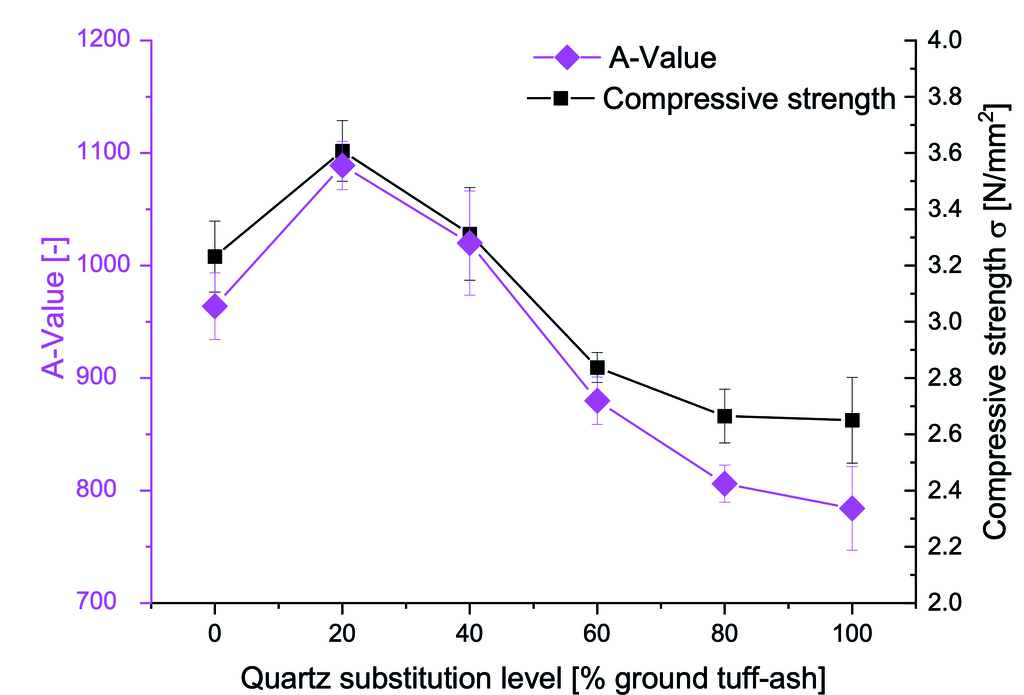
The A-value, developed by Ytong company in 1978, provides a comprehensive assessment of the material performance by considering the relationship between the compressive strength and raw density of AAC [23]. As shown in Fig. 5, the A-value shows the same trend as the compressive strength.
The peak value can be attributed to the enhanced reactivity of TA during the hydrothermal curing process, promoting the formation of a denser and more homogeneous matrix. The high specific surface area and amorphous nature of TA contribute to increased dissolution of silica and alumina, which participate in the formation of strength-giving phases such as calcium silicate hydrates (C-S-H) and aluminium-substituted tobermorite. The following drop may result from lower overall SiO2 content and microstructural changes. Despite a 60% reduction in total mix SiO2 content, compressive strength decreases by only 20% with full TA replacement, highlighting its potential as a sustainable AAC alternative that maintains substantial strength with significantly reduced silica content.
It is important to note that substitution does not significantly affect the porosity, the change is within the normal error range. Higher porosity generally corresponds to lower compressive strength, as the presence of more voids in the matrix reduces its load-bearing capacity and increases its insulating properties. This relationship is further evident in Fig. 6, where the thermal conductivity of the samples only slightly decreases.
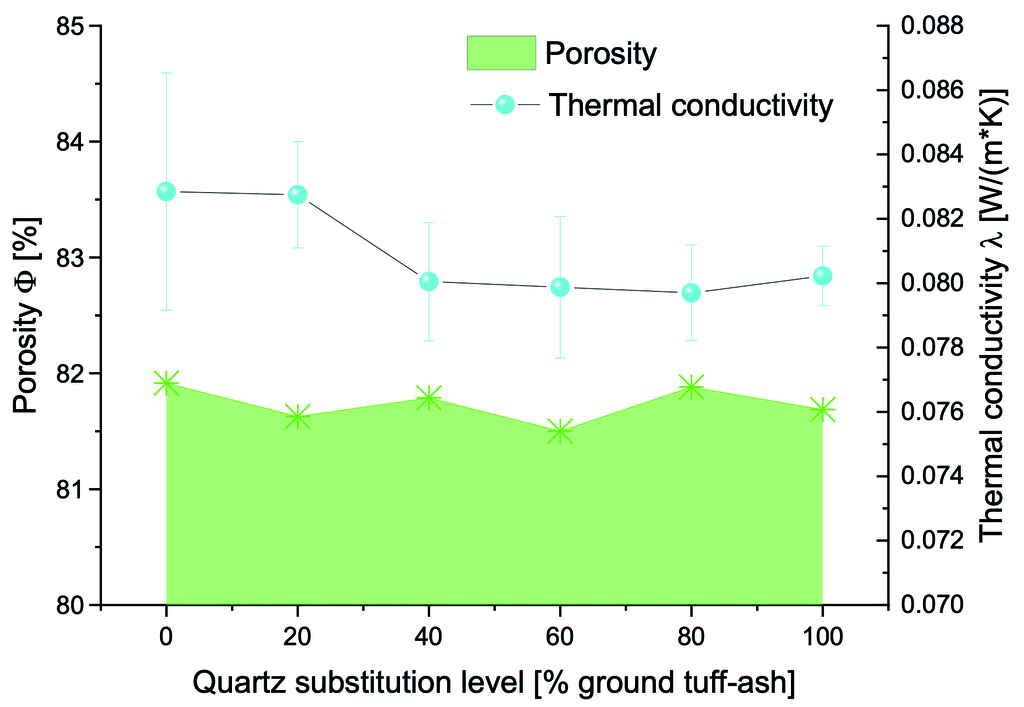
Thermal conductivity decreases marginally with increasing TA content (by ≈0.003 W/(m·K)), probably due to the porous nature of the glassy phases. All samples maintain thermal conductivity within the typical range for commercial AAC (0.07-0.11 W/(m·K)), suggesting that TA incorporation does not compromise insulating properties and may slightly enhance thermal efficiency. The discrepancy between stable total porosity and varying properties underscores the importance of pore structure and distribution in determining material characteristics. Tuff ash likely alters pore size distribution and connectivity without affecting overall porosity, significantly impacting strength and slightly thermal conductivity.
Discussion
Role of TA on the phase composition and shrinkage
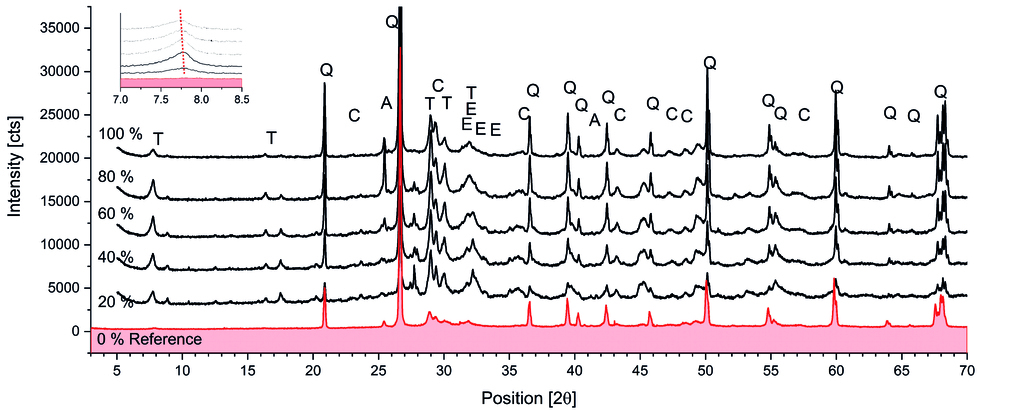
Fig. 7 presents the XRD patterns and SEM images of the AAC samples with different TA substitution levels. The incorporation of TA in AAC led to significant changes in phase composition, as revealed by the XRD analysis (Fig. 7a). A new phase, identified as katoite (hydrogarnet), was observed in TA-containing samples. The intensity of the tobermorite 002 peak (11.3 Å) increased for all samples containing TA, with the highest intensities observed in the 40% and 60% replacement samples. This increase was corroborated by similar behaviour in the -220 peak of tobermorite (3.08 Å), indicating a genuine increase in tobermorite content.
A notable peak shift was observed for the 002 peak, from 11.30 Å to 11.43 Å, consistent with aluminium incorporation into the bridging silicon tetrahedra of the tobermorite structure. This shift indicates a higher incorporation of aluminium in the tobermorite structure, suggesting that the aluminium components from the TA participate in the reaction. The incorporation of aluminium in the tobermorite structure can lead to the formation of aluminium tobermorite, which is known to enhance the thermal stability and mechanical properties of AAC. These microstructural modifications provide insights into the observed changes in mechanical and thermal properties of TA-containing AAC samples, highlighting the relationship between phase composition and macroscopic properties.
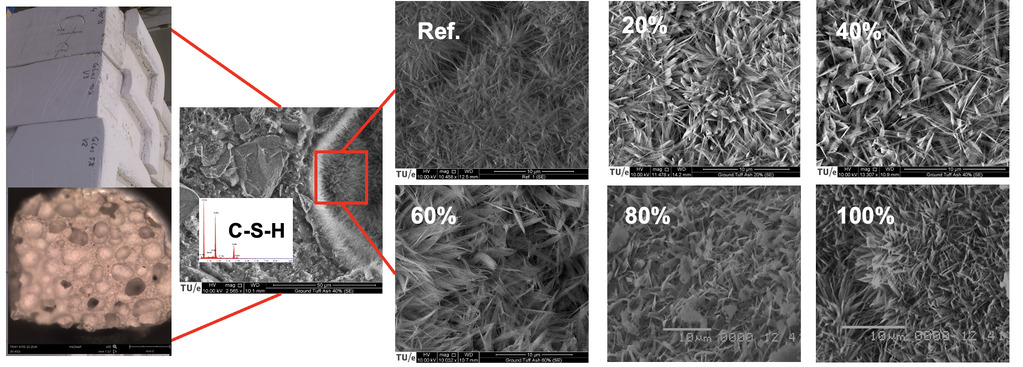
The SEM images provide visual evidence of the microstructural differences between the reference sample and the samples containing TA. A good way to observe the quality of tobermorite is to investigate the shape of the crystals in the pores, where they can grow freely in space. In general, tobermorite crystals have a platy shape. The reference AAC sample shows tobermorite with a more needle-like character, which is closer to the C-S-H (I) gel than the crystalline modification. The samples containing TA exhibit a significant improvement in tobermorite crystallinity with increasing substitution levels. The 20% TA sample shows tobermorite crystals with a more platy shape compared to the reference, indicating enhanced crystallinity. The 40% TA sample displays well-developed, sword-like tobermorite crystals, which are considered optimal for the mechanical properties of AAC. However, further increasing the TA content to 60% results in a decrease in tobermorite crystallinity, suggesting that there is an optimal level of TA substitution for achieving the desired crystal morphology.
The CaO/SiO2 ratio increases with increasing TA content, ranging from 0.36 (reference) to 0.66 (100% TA). This increase in CaO/SiO2 ratio can be attributed to the higher CaO content and lower SiO2 content in TA compared to quartz. The increased CaO/SiO2 ratio and alumina from TA promotes a higher proportion of well-developed tobermorite crystals with improved crystallinity, which play a crucial role in the strength development and thermal insulation properties of AAC.
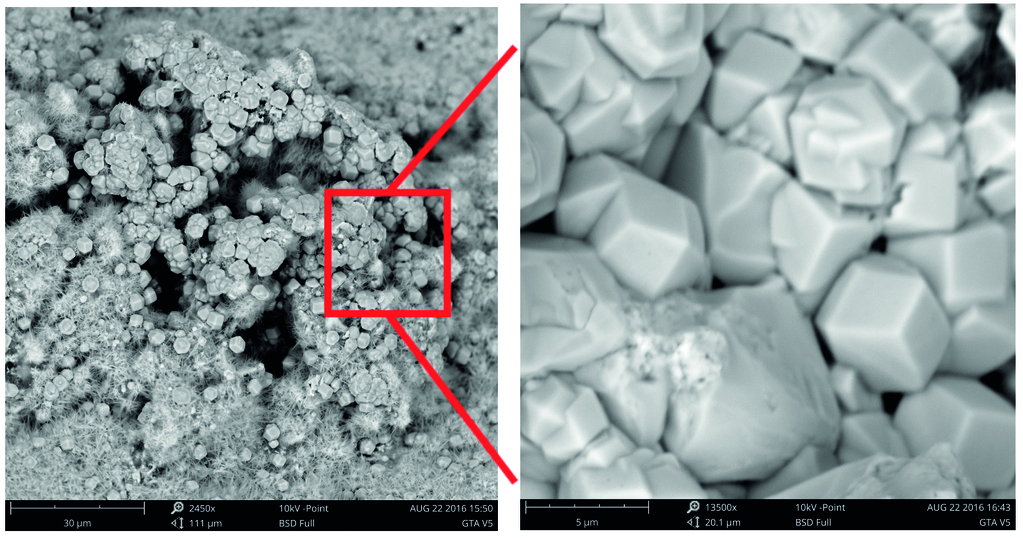
The incorporation of TA in AAC samples also resulted in the formation of a new phase, hydrogarnet, as evidenced in Fig. 8. This phase is likely attributed to the higher Al2O3 content in TA reacting with Ca(OH)2 and SiO2 under hydrothermal conditions. Hydrogarnet plays a crucial role in adsorbing hazardous elements, potentially enhancing the environmental performance of AAC. However, it does not contribute to strength development due to its non-participation in the interlocking crystal structure typical of strength-giving phases. The presence of hydrogarnet may explain the observed compressive strength trend, peaking at 20% TA replacement and decreasing thereafter. This trend reflects hydrogarnet dual role: initially filling pores and increasing density, but at higher concentrations, competing with tobermorite formation by limiting available calcium ions.
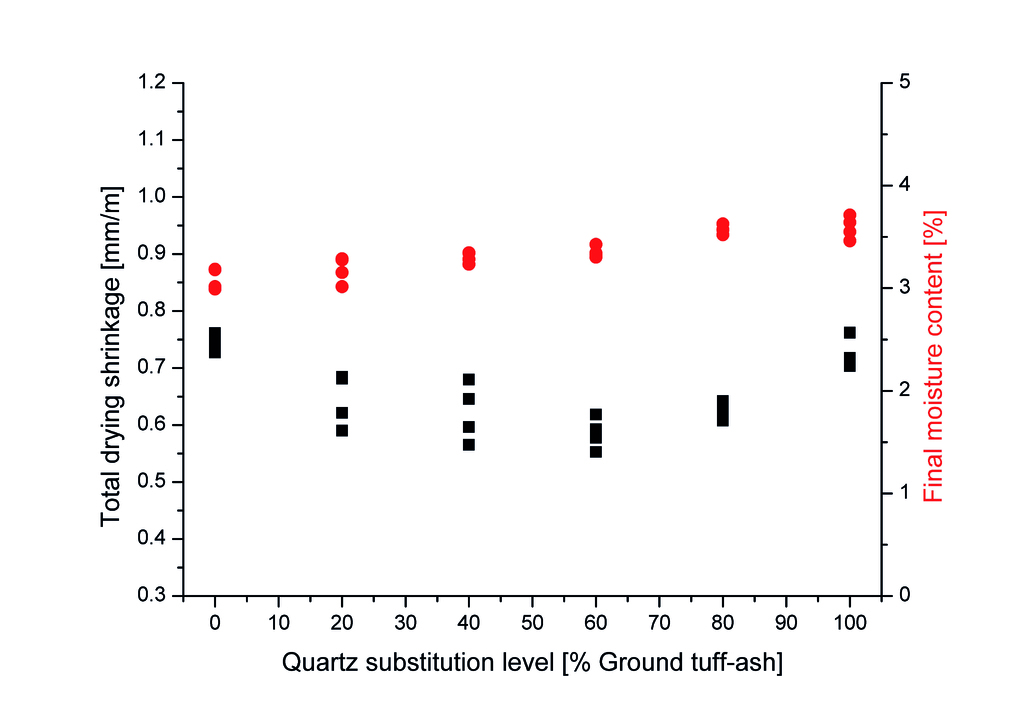
The drying shrinkage results in Fig. 9 show that the incorporation of TA leads to a reduction in shrinkage compared to the reference for all replacement levels. As the TA substitution level increases, the shrinkage initially decreases, reaching a minimum value of approximately 0.55% at 60% TA content. However, further increasing the TA content to 80% and 100% results in a slight increase in shrinkage, although still lower than the reference. This non-linear trend highlights the complex relationship between TA content and shrinkage behaviour.
This trend in shrinkage can be related to the changes in tobermorite crystallinity observed in the SEM images. The improved tobermorite crystallinity in the TA-containing samples, particularly at 40% and 60% substitution levels, likely contributes to the reduction in shrinkage. The well-developed tobermorite crystals in these samples help to create a more stable and interconnected matrix, which is less susceptible to shrinkage during drying. The slight increase in shrinkage at higher TA substitution levels (80% and 100%) may be attributed to the decrease in tobermorite crystallinity & content observed in the SEM images. As the TA content increases beyond the optimal level, the formation of less tobermorite may lead to a more open and less stable pore structure, which can facilitate moisture loss and increase shrinkage. This is in agreement with the observed compressive strength.
However, it is important to note that despite the slight increase in shrinkage at high TA contents, all samples containing TA exhibit lower shrinkage values compared to the reference sample. This indicates that the incorporation of TA has an overall beneficial effect on reducing shrinkage, due to the improved tobermorite crystallinity and the formation of a more stable matrix. The relationship between porosity and shrinkage in the TA-containing samples appears to be less straightforward than initially assumed. While the porosity results (Fig. 6) show basically no changes with increasing TA content, the shrinkage values do not follow the same trend. This suggests that the pore structure and distribution, rather than the overall porosity, have a more significant influence on the shrinkage behaviour of the AAC samples containing TA.
Environmental Impacts
The incorporation of TA as a partial or complete substitute for sand in AAC production offers significant environmental advantages, particularly in terms of energy consumption and associated carbon emissions. This study quantifies these benefits using the Rittinger equation to calculate energy consumption for the milling process:
E = K * (S2 - S1)
Where E represents specific energy consumption (kWh/ton), K is the Rittinger constant (1.25 * 10-3 kWh*m²/ton for minerals), S1 is the initial specific surface area (estimated at 0.1 m²/kg for coarse sand), and S2 is the final specific surface area (m²/kg).
The calculations indicate that milling TA to a Blaine surface area of 2750 cm²/g requires only 34.3 kWh per ton, compared to 75.8 kWh per ton for sand to achieve 6070 cm²/g. For a medium-sized AAC plant with a daily production of 1000 m³, this translates to potential energy savings of 12450 kWh per day when fully replacing sand with TA. Annually, this could amount to over 4.5 million kWh in energy savings, leading to a reduction in CO2 emissions exceeding 2250 tons, based on an average emission factor of 0.5 kg CO2 per kWh.
However, it is important to note that these calculations likely underestimate the actual environmental benefits. Quartz sand, commonly used in AAC production, is notoriously difficult to mill, often requiring extensive crushing and grinding processes. Energy consumption for sand processing varies significantly depending on its source and processing methods. In contrast, TA typically has a finer initial particle size and lower quartz content, requiring less energy-intensive processing. This difference leads to considerable energy savings in material preparation, potentially eliminating or significantly reducing the need for energy-intensive crushing, extended milling times, and post-milling processing. Consequently, the actual reduction in energy consumption and CO2 emissions is likely to be even greater than the conservative estimates suggest. Moreover, it should be noted that these calculations represent an ideal scenario. Actual energy savings may vary depending on specific production conditions, raw material characteristics, and processing techniques. Nevertheless, even with conservative estimates, the potential for significant energy and CO2 emission reductions is evident.
Conclusion
This comprehensive study investigated the incorporation of TA as a partial replacement for quartz in AAC production, examining its effects from fresh behaviour and green body development to hardened state properties. The following conclusions can be drawn:
1. Tuff ash incorporation does not significantly alter AAC flowability but accelerates the green body hardening process, potentially reducing production time.
2. Compressive strength and A-value improve at TA replacement levels up to 20%, attributed to enhanced reactivity and increased tobermorite crystallinity.
3. Thermal conductivity decreases with increasing TA content (from 0.08285 to 0.07970 W/(m·K)), while overall porosity remains stable, indicating improved insulation properties without compromising structural integrity.
4. Tuff ash utilization in AAC production offers significant environmental benefits, potentially reducing energy consumption by 12450 kWh per day for a medium-sized plant, contributing to more sustainable construction practices.
Acknowledgements
This research was funded by the National Natural Science Foundation of China U22A20122, 52372032, 51902235), Eindhoven University of Technology and the framework of the Research Program of the Materials innovation institute M2i (www.m2i.nl), Project Number M81.6.12478, together with the industrial partner Hess AAC Systems. Many thanks as well to Knauf Gips KG, Holcim (Deutschland) AG, Fels-Werke GmbH and HeidelbergCement Benelux for supplying materials, and Tata Steel for using their SEM, as well as to the Fachgruppe Mineralogie/Geochemie from Martin-Luther Universität Halle-Wittenberg (Germany) for the use of their XRD. Furthermore, the authors wish to express their gratitude to the sponsors of the Building Materials research group at TU Eindhoven.
Conflicts of Interest
The authors declare no conflict of interest.
Declaration of generative AI and AI-assisted technologies in the writing process
During the preparation of this work the authors used Claude in order to assist with language refinement and to enhance readability. After using this tool/service, the authors reviewed and edited the content as needed and take full responsibility for the content of the publication.
References
[1] O.E. Ogunmakinde, T. Egbelakin, W. Sher, Contributions of the circular economy to the UN sustainable development goals through sustainable construction, Resour. Conserv. Recycl. 178 (2022).
[2] M.U. Hossain, S.T. Ng, P. Antwi-Afari, B. Amor, Circular economy and the construction industry: Existing trends, challenges and prospective framework for sustainable construction, Renew. Sustain. Energy Rev. 130 (2020).
[3] K.E. Lai, N.A. Rahiman, N. Othman, K.N. Ali, Y.W. Lim, F. Moayedi, M.A.M. Dzahir, Quantification process of carbon emissions in the construction industry, Energy Build. 289 (2023).
[4] L. Huang, G. Krigsvoll, F. Johansen, Y. Liu, X. Zhang, Carbon emission of global construction sector, Renew. Sustain. Energy Rev. 81 (2018).
[5] E. Michelini, D. Ferretti, L. Miccoli, F. Parisi, Autoclaved aerated concrete masonry for energy efficient buildings: State of the art and future developments, Constr. Build. Mater. 402 (2023).
[6] Abhilasha, R. Kumar, R. Lakhani, R.K. Mishra, S. Khan, Utilization of Solid Waste in the Production of Autoclaved Aerated Concrete and Their Effects on its Physio-mechanical and Microstructural Properties: Alternative Sources, Characterization, and Performance Insights, Int. J. Concr. Struct. Mater. 17 (2023).
[7] Z.O. Pehlivanlı, İ. Uzun, İ. Demir, Mechanical and microstructural features of autoclaved aerated concrete reinforced with autoclaved polypropylene, carbon, basalt and glass fiber, Constr. Build. Mater. 96 (2015).
[8] B. Yuan, C. Straub, S. Segers, Q. L. L. Yu, H. J. H. J. H. Brouwers, Sodium carbonate activated slag as cement replacement in autoclaved aerated concrete, Ceram. Int. 43 (2017).
[9] Agnieszka Różycka, Waldemar Pichór, Effect of perlite waste addition on the properties of autoclaved aerated concrete, Constr. Build. Mater. 120 (2016).
[10] H. El-Didamony, A.A. Amer, M.S. Mohammed, M.A. El-Hakim, Fabrication and properties of autoclaved aerated concrete containing agriculture and industrial solid wastes, J. Build. Eng. 22 (2019).
[11] André Hauser, Urs Eggenberger, Thomas Mumenthaler, Fly ash from cellulose industry as secondary raw material in autoclaved aerated concrete, Cem. Concr. Res. 29 (1999).
[12] Xiao-yan Huang, Wen Ni, Wei-hua Cui, Zhong-jie Wang, Li-ping Zhu, Preparation of autoclaved aerated concrete using copper tailings and blast furnace slag, Constr. Build. Mater. 27 (2012).
[13] J. Alexanderson, Relations between structure and mechanical properties of autoclaved aerated concrete, Cem. Concr. Res. 9 (1979).
[14] N.Y. Mostafa, Influence of air-cooled slag on physicochemical properties of autoclaved aerated concrete, Cem. Concr. Res. 35 (2005).
[15] P.N. Lemougna, K. Wang, Q. Tang, A.N. Nzeukou, N. Billong, U.C. Melo, X. Cui, Review on the use of volcanic ashes for engineering applications, Resour. Conserv. Recycl. 137 (2018).
[16] A. Játiva, E. Ruales, M. Etxeberria, Volcanic ash as a sustainable binder material: An extensive review, Materials 14 (2021).
[17] A.M. Al-Swaidani, S.D. Aliyan, Effect of adding scoria as cement replacement on durability-related properties, Int. J. Concr. Struct. Mater. 9 (2015).
[18] K.M.A. Hossain, Volcanic ash and pumice as cement additives: pozzolanic, alkali-silica reaction and autoclave expansion characteristics, Cem. Concr. Res. 35 (2005).
[19] J. Rosales, M. Rosales, J.L. Díaz-López, F. Agrela, M. Cabrera, Effect of Processed Volcanic Ash as Active Mineral Addition for Cement Manufacture, Materials 15 (2022).
[20] J.N.Y. Djobo, D. Stephan, A. Elimbi, Setting and hardening behavior of volcanic ash phosphate cement, J. Build. Eng. 31 (2020).
[21] J. Bawab, A. El-Dieb, H. El-Hassan, J. Khatib, Effect of different activation techniques on the engineering properties of cement-free binder containing volcanic ash and calcium carbide residue, Constr. Build. Mater. 408 (2023).
[23] M.T. De Grazia, L.F.M. Sanchez, A. Yahia, Towards the design of eco-efficient concrete mixtures: An overview, J. Clean. Prod. 389 (2023).
[26] M. Chrysochoou, D. Dermatas, Evaluation of ettringite and hydrocalumite formation for heavy metal immobilization: Literature review and experimental study, J. Hazard. Mater. 136 (2006).