Science & Innovation
Experimental investigation
The influence of density on the properties of AAC
Loading...
Elena Michelini is Assistant Professor of Structural Design at the Department of Engineering and Architecture, University of Parma. She is author of more than 60 papers on RC concrete and masonry structures (cracking, nonlinear analysis, tunnels, precast RC elements, FRC, FRCM, AAC). She participated in several research projects funded by private companies or public administrations, mainly focused on the structural optimization of new RC and FRC elements and on the vulnerability assessment of existing RC and masonry structures.
elena.michelini@unipr.it

Daniele Ferretti is Associate Professor of Structural Design at the Department of Engineering and Architecture, University of Parma. He is author of 100 scientific papers on reinforced concrete structures (cracking, nonlinear analysis, FRP, FRCM), masonry (AAC, adobe), and structural/seismic behaviour of ancient buildings. He was principal investigator of several research projects funded by companies or public administrations for the analysis of RC or masonry structures and for the seismic assessment of ancient buildings (towers, theatres, cathedrals).
daniele.ferretti@unipr.it
In developed countries, the need to ensure adequate thermal comfort for building occupants causes the consumption of about 30-40% of the total energy use, which in Europe and the USA is greater than that required by industrial and transport sectors [1-3]. New solutions to improve and promote energy savings in the building stock have therefore become an immediate strategic priority, as confirmed by the recent proposal for a new directive on energy efficiency within the package “Delivering on the European Green Deal” [4]. Energy losses in buildings are related to different factors: the characteristics of the building envelope (walls, floors, and roof) and transparent enclosures, the building’s exposure, the efficiency of heating and cooling systems, and the efficiency of the systems for DHW (domestic hot water) production [5]. For this reason, the enhancement of building energetic performances to achieve the target of Near-Zero-Energy- Buildings (NZEB) can be pursued following different strategies, which can act at different levels. From the point of view of building insulation, an important role is played by the characteristics of the materials used for the construction of the envelope. To improve the thermal performance of buildings and minimize energy loss, materials with low thermal conductivity, good moisture management and, if possible, variable opaque surface properties should be adopted [5]. Autoclaved Aerated Concrete (AAC) represents a viable alternative to other classic construction materials, thanks to its low thermal conductivity, which ranges from 0.07 to 0.13 W/mK for commercial density values between 300 and 600 kg/m3. Recently, blocks with even lower densities, up to 250 kg/m3, and with increased thermal performance, were introduced to the European market. Moreover, AAC masonry prevents thermal bridges and reduces air leakages [6,7]. According to [7], these factors can reduce energy consumption related to cooling by 12%, and total energy consumption of residential buildings by about 7%. Another advantage of AAC, which makes it similar to ultra-lightweight concretes, is that it combines good thermal and structural performances in a single material. It can therefore be used for the realization of load-bearing masonry with high insulation potential, reducing the need to add additional external insulation layers [8-11]. This is an important aspect also when referring to recyclability and to the reduction of waste materials to be stored in landfills at the end of the life cycle of the building [12]. Both thermal and structural performance of AAC are strictly related to material porosity, and therefore, to its density, which is usually altered by modifying the dosage of the expanding agent in the slurry during the manufacturing process [13]. Although it is well known that density influences all the mechanical properties (compressive strength, tensile strength, fracture energy, elastic modulus), well-established relations to be used in current practice are not available in the literature. Most of the relations proposed by single authors are strictly dependent on the specific raw materials (especially if industrial by-products are used in the production process) and on autoclaving conditions; while the equations suggested in design Standards from different countries [14-18] may lead to very dispersed results, as better discussed in [19]. In this project, the results of a wide experimental campaign carried out at the Laboratory of Materials and Structures of the University of Parma on AAC specimens belonging to four density grades available on the European market (300, 350, 480, and 580 kg/m3, see also [20, 21]) are presented and discussed. The main aim of the publication is to provide further data than can be useful to better understand the influence exerted by density on the mechanical and thermal performance of the final products.
Overview of the performed experimental campaign
In the performed experimental campaign, AAC specimens were cut from commercially available blocks with four different densities ranging from 300±50 to 580±50 kg/m3. Different types of tests were carried out, for a preset moisture content of the specimens of 6±2%, including compression tests on cubes according to EN 772-1 [22], flexural tests on prisms according to EN 1351 [23], fracture energy tests on prisms according to JCI-S-001 [24], and tests for the determination of the elastic modulus on cylindrical specimens according to Rilem Recommended Practice [18]. Specimens were preliminary conditioned in an oven at a temperature not exceeding 50°C, until their mass reached the dry mass determined on companion samples, multiplied by 1.06. Subsequently, they were stored at ambient temperature for at least 5 hours before testing.
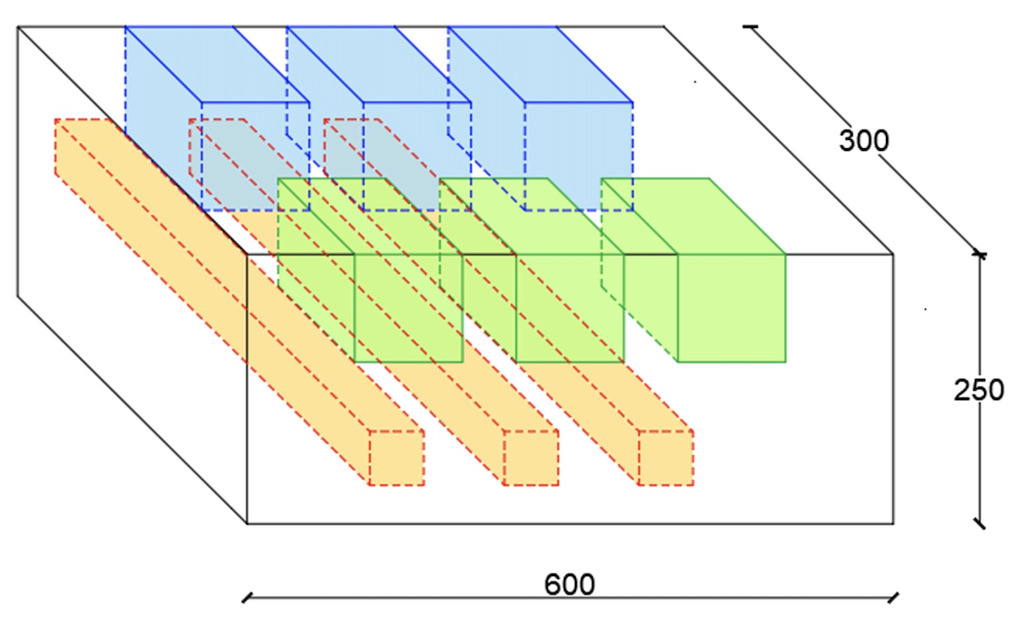
The sampling scheme for compression and flexural tests is shown in Figure 1. It can be seen that 3 specimens were cut from the top, middle, and bottom part of each block with respect to the direction of rising; moreover, three additional “twin” cubes were extracted from each block to perform density measurements. To reduce the number of tests, it was decided to take the specimens for the determination of fracture energy and elastic modulus from the central part of each block, which is approximately representative of the mean properties of the block itself.
For an intermediate density value (350±50 kg/m3), compression, flexural and fracture energy tests were repeated with varying moisture content at the time of testing, in the interval from the dry state to a moisture content of about 20-30% (which corresponds to the condition of the blocks at delivery at the laboratory/construction site). All the specimens, except those to be tested at a moisture content of 20-30%, were subjected to thermal treatment before testing. For moisture contents equal to 6% and 15%, the curing procedure already discussed was applied, while specimens in the dry state were dried in an oven at 70±5°C until a constant mass was reached, and then left at room temperature for at least 5 hours. In total, 351 specimens were analysed.
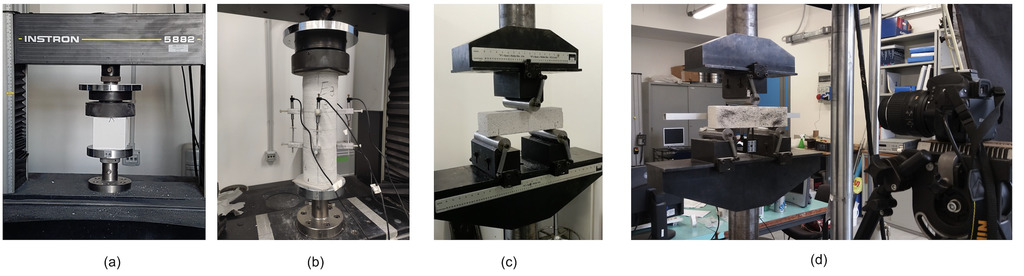
A general view of the experimental setup adopted for the different types of test is shown in Figure 2. Both compression tests and those for the determination of the elastic modulus were carried out by using an Instron 5882 universal testing machine working under loading control (Fig. 2 a, b), with a constant loading speed up to failure or by following the time-loading diagram suggested in [18], respectively. Cubes were not instrumented, while core specimens were equipped with four LVDTs, as shown in Figure 2b.
An Instron 8862 universal testing machine was used to perform flexural and fracture energy tests on prismatic specimens (Fig. 2 c, d), having the same dimensions (50 x 50 x 200 mm3, by keeping a net span equal to 150 mm). Flexural tests were carried out under loading control, while for fracture energy tests, Crack Mouth Opening Displacement (CMOD) control was preferred. The specimens used for fracture energy tests were pre-notched in the central bottom part, to guide crack formation. In the latter case, displacements were measured in a twofold manner: through a LVDT, monitoring midspan deflection, and through Digital Image Correlation (DIC) technique, which is an optical method that exploits image registration at predefined time intervals for accurate 2D measurements of changes in images. For this reason, the surface of the specimens was preliminary sprayed with black paint to create a speckle pattern (Fig. 2d). For image acquisition, a high-resolution camera (Nikon D5100) was used, and image post-processing was applied with the software Ncorr [25], in a Matlab environment.
Main results and discussion
Compressive strength
Figure 3a shows the experimental dependency of compressive strength on density, and the comparison of the results with other data available from the literature [26 - 29]. The experimental results (triangle with black edges) refer to a moisture content of 6±2%. Each triangle on the graph (corresponding to a sample) represents the mean compressive strength of three companion cubes, obtained according to Figure 1. It can be seen that at least 6 samples are available for each density class. These results highlight that the relation between density and compressive strength is exponential, as also suggested in other works from the literature [13, 30]. The regression curve equation obtained from the best fit of experimental data is reported on the same graph (black curve). From the same Figure 3a, it can be inferred that the obtained experimental results are in line with those reported in [27], which refer to other blocks available on the European market. In contrast, a bigger scatter is registered when the same data are compared with those reported in [26, 28-29], but this could be attributable to the presence of waste materials and industrial by-products in the admixture, which may exert a not negligible influence on compressive strength. Moreover, experimental data lie within the range suggested by RILEM Recommended Practice [18], at least for density values higher than 350 kg/m3. For lower densities, RILEM provisions (which are relatively old, dating back to the ’90s) are somewhat conservative, indicating that the production process has been optimized during the last decades.
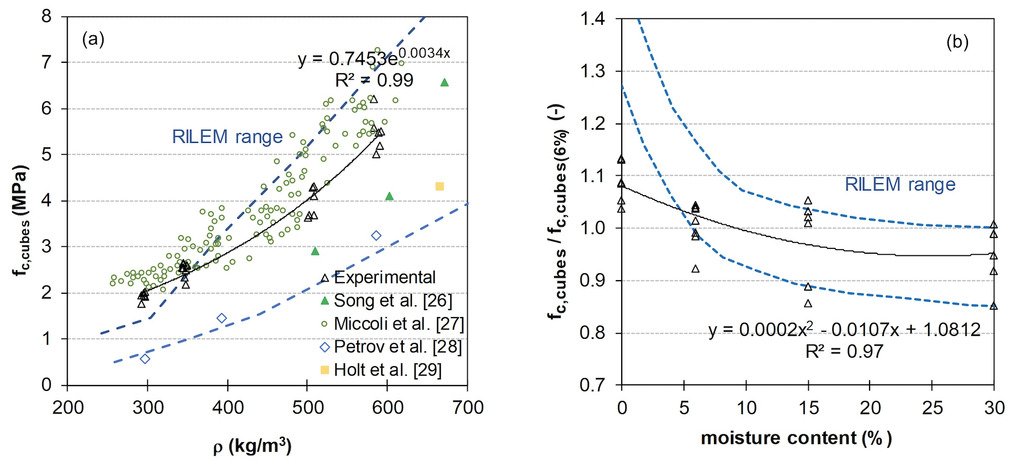
The variation of dimensionless compressive strength with moisture content for a given density (equal to 350 kg/m3) is reported in Figure 3b. For the sake of clarity, the results relative to those specimens with a moisture content ranging between 20 and 30% are all referred in the graph to a nominal moisture content of 30%. It is well known that AAC compressive strength depends on moisture, and this effect is also considered by Standard Codes. For example, according to the Standard EN 772-1 [22] followed in this work, different types of curing can be applied before test execution, including conditioning to air dry condition, oven-dry condition, and 6% moisture content, and immersion. Appendix A of the same Standard specifies that the so obtained strengths should be normalised before design application, by converting them into an equivalent compressive strength relative to the air-dry conditioning regime (corresponding to the normal condition for construction purposes), by using the multiplying coefficient 1 for conditioning to air dry condition or 6% moisture content, 0.8 for oven-dry condition, and 1.2 for conditioning by immersion. Experimental data reported in the graph of Figure 3b were then normalized with respect to the mean experimental strength value corresponding to conditioning at 6% moisture content. The data highlight that for the considered material, the ratio between fc,cubes (6%) / fc,cubes (0%) is almost equal to 0.92, showing that the coefficient 0.8 suggested by the Standard (and by Rilem Recommended Practice [18]) is slightly conservative. The data also show that compressive strength remains almost constant for moisture contents higher than 15%, and this trend seems also confirmed by the good agreement with the range suggested by Rilem [18]. The regression curve (black line) obtained from the best-fitting of the experimental data is in this case polynomial, as depicted in Figure 3b.
Flexural strength and fracture energy
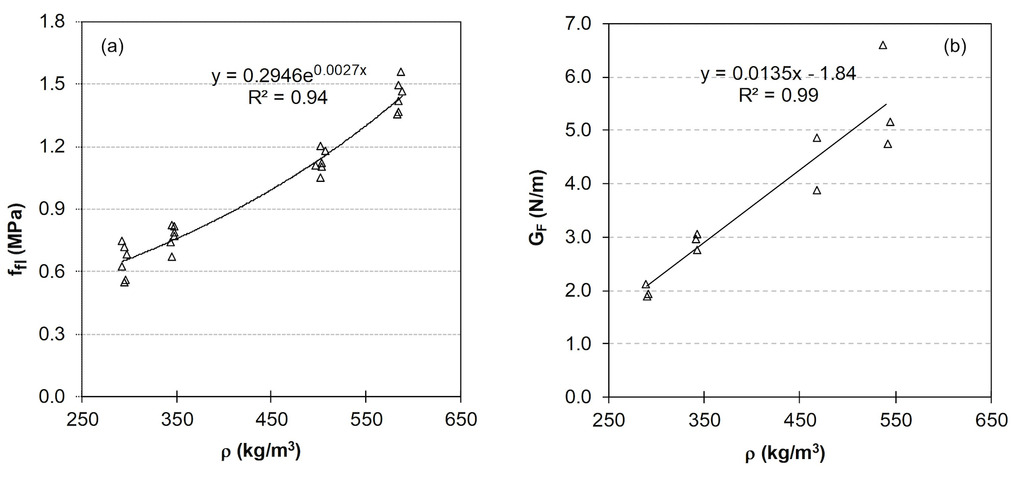
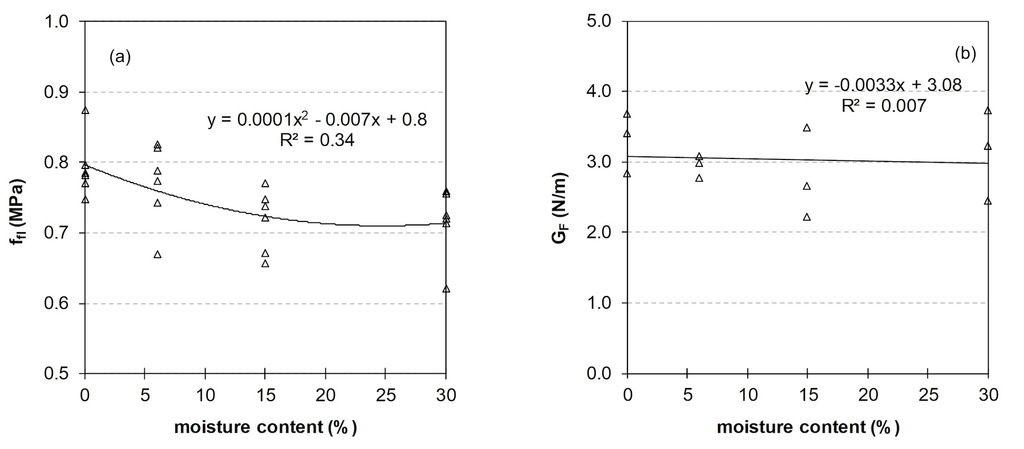
The relation between flexural strength and density is reported in Figure 4a, for the specimens conditioned at a moisture content equal to 6±2%. Also in this case, each triangle represents the average value obtained from three companion specimens, as depicted in Figure 1. As can be seen from the best-fitting curve reported in the graph, the dependency is slightly exponential. If flexural strengths are plotted against the corresponding compressive strength values, an almost linear relation can be found, as reported in [20]. This linear relation is very well fitted by the equation suggested by Rilem Recommended Practice [18], that is:
ffl = 0.27 + 0.21 fc,cubes. (1)
Equation 1 was indeed calibrated on specimens having the same shear span to depth ratio (equal to 1.5) and the same experimental setup (three-point bending test) as those adopted in the experimental campaign discussed here.
On the fracture energy side, the variation with density appears to be almost linear, as shown in Figure 4b. In this case, each triangle is referred to a single prismatic specimen, taken from the central part of the block. Fracture energy was determined according to the relation suggested in [24], and consequently depended on the area under the complete load vs. CMOD (crack mouth opening displacement) curve (multiplied by a reduction coefficient equal to 0.75) divided by the area of the broken ligament, which is the cross-section area of the specimen at midspan, excluding the portion interested by the notch. It should be observed that the reduction coefficient of 0.75 proposed in [24] was calibrated for standard concrete specimens; however, it was verified in this work that it can be successfully applied also to AAC specimens. To this end, fracture energy values calculated according to [24] were preliminarily compared to those obtained from the general fracture mechanics equation, which in turn depend on the area under the load vs. midspan deflection curve. Midspan deflection measurements were in this case available both from DIC elaborations and from LVDT data acquisition.
The dependency of tensile properties (flexural strength and fracture energy) on moisture content is reported in Figure 5, with reference to a density class of 350 kg/m3. While flexural strength decreases with increasing moisture content, the fracture energy seems to be almost independent from this parameter.
Elastic modulus
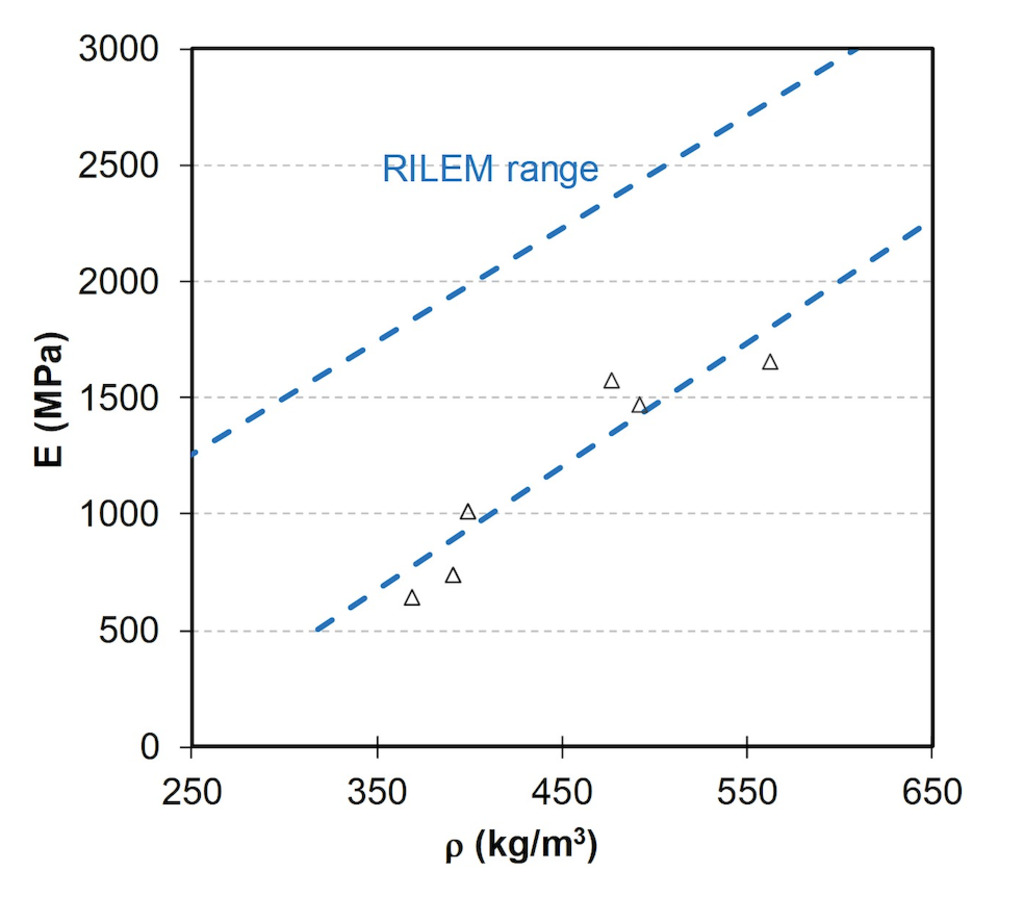
The experimental relation between elastic modulus and density is shown in Figure 6. In this case, only two density classes were explored, and each triangle on the graph corresponds to a core specimen extracted from the central part of the block. The dependency is almost linear, and the experimental data are well fitted by the lower bound of the Rilem range [18], which is expressed by the equation:
E = (-520+ 4.7 ρ) ± 500 MPa. (2)
It is important to notice that if the elastic modulus is simply deduced from the initial slope of the load vs. displacement curve obtained from compression tests on cubes, lower, unreliable values are obtained (see [20]). This is the reason why specific tests according to relevant Standards should be always performed.
Thermal conductivity
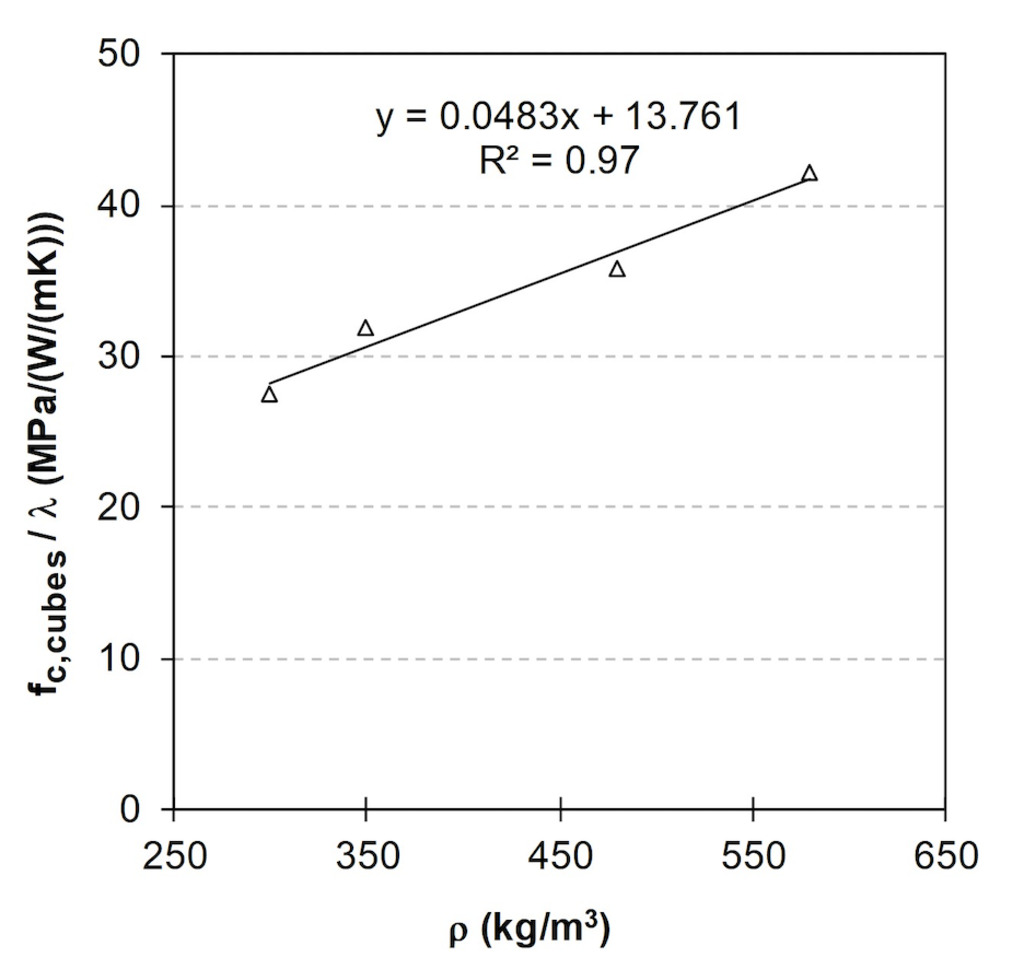
Based on the analysis of available data from the literature (see [20]), it can be inferred that the relation between thermal conductivity and density is clearly linear, with increasing thermal insulation capacity associated with reduced density values. While compressive strength is affected by several intrinsic and extrinsic factors (the most important are certainly represented by porosity, raw materials used in the admixture, autoclaving conditions, geometry, and dimensions of tested specimens), thermal conductivity seems to be basically dependent on porosity, and therefore on density. For this reason, up to date, one of the most common strategies used by producers to increase the thermal performances of the blocks is to reduce density by adjusting the dosage of the expanding agent added to the slurry. With reference to the products tested in this study, the average values of thermal conductivity are known from the technical sheets from the producer, and range between 0.07 to 0.13 W/mK. Figure 7 reports the ratio between average compressive strength (determined on cubes) and thermal conductivity as a function of density. The ratio between mechanical and environmental properties provides a sort of eco-mechanical index (see for example [31]), which can be seen as a representative parameter for quick evaluation of the efficiency of materials from combined structural and environmental points of view, without having to perform a complete LCA assessment. With regards to this point it should be considered that also for lower densities, which correspond to blocks used for cladding and infills in frame structures, minimum structural requirements should be guaranteed to prevent undesired anticipated cracking phenomena during the service life of the building. Thermal conductivity is herein chosen as an environmental parameter because its values are readily available for every product on the market with respect to other environmental parameters (like for example the global warming potential), and because it is a material property, differently from thermal transmittance, which also depends by the final layout of the wall. For the considered products, this eco-mechanical index ranges approximately from 28 to 42 MPa/(W/(mK)) with densities ranging from 300 to 580 kg/m3. Since the relation between the ratio (fc,cubes/λ) and the density is almost linear, a first estimate of compressive (and also tensile) strength of lower density blocks can be directly obtained, based on the knowledge of density and thermal conductivity.
Conclusions
The results of a wide experimental campaign on AAC blocks with different densities carried out at the Laboratory of Materials and Structures of the University of Parma is presented in this publication. The experimental campaign aimed at providing additional data relative to the products available on the European market, which can be used to find robust and broadly accepted correlations between mechanical properties and density, to be used in structural design and Finite Element Analyses. Experimental results show an almost linear dependence of fracture energy and elastic modulus on density, while the relation between compressive strength and density appears to be exponential. Also, the ratio between compressive strength and thermal conductivity, which can be seen as a sort of quick eco-mechanical index, shows a linear dependence on density.
Acknowledgments
This work is part of a research founded by Ekoru s.r.l., within the PON national project n. F/090017/00/X36, CUP B18I17000450008. Authors gratefully thank Dr. F. Talento, Arch. A. Riva and Dr. F. Pagliari for their valuable help.
References
[1] Cornaro, Cristina, and Cinzia Buratti. "Energy efficiency in buildings and innovative materials for building construction." Applied Sciences 10.8 (2020): 2866.
[2] Omrany, Hossein, et al. "Application of passive wall systems for improving the energy efficiency in buildings: A comprehensive review." Renewable and sustainable energy reviews 62 (2016): 1252-1269.
[3] Díaz, Juan José Vinagre, Mark Richard Wilby, and Ana Belén Rodríguez González. "Setting up GHG-based energy efficiency targets in buildings: The Ecolabel." Energy policy 59 (2013): 633-642.
[4] European Commission. “Proposal for a Directive of the European Parliament and of the Council on Energy Efficiency (Recast)”; Brussels, 2021.
[5] Judkoff, Ron. "Increasing building energy efficiency through advances in materials." MRS bulletin 33.4 (2008): 449-454.
[6] Becker, Rachel. "Air permeability and thermal performance of concrete block wall specimens." Journal of Building Physics 34.2 (2010): 163-177.
[7] Radhi, Hassan. "Viability of autoclaved aerated concrete walls for the residential sector in the United Arab Emirates." Energy and buildings 43.9 (2011): 2086-2092.
[8] Hendry, A. W. "Masonry walls: materials and construction." Construction and Building materials 15.8 (2001): 323-330.
[9] Pacheco-Torgal, Fernando, et al., eds. “Eco-efficient masonry bricks and blocks: design, properties and durability”. Woodhead Publishing, 2014.
[10] Li, Fenglan, et al. "Fundamental properties and thermal transferability of masonry built by autoclaved aerated concrete self-insulation blocks." Materials 13.7 (2020): 1680.
[11] Roberz, F., et al. "Ultra-lightweight concrete: Energy and comfort performance evaluation in relation to buildings with low and high thermal mass." Energy and Buildings 138 (2017): 432-442.
[12] Lam, Nguyen Ngoc. "Recycling of AAC Waste in the Manufacture of Autoclaved Aerated Concrete in Vietnam." GEOMATE Journal 20.78 (2021): 128-134.
[13] Schober, Georg. "Porosity in autoclaved aerated concrete (AAC): A review on pore structure, types of porosity, measurement methods and effects of porosity on properties." 5th International Conference on Autoclaved Aerated Concrete. No. 39-43. Bydgoscsz Poland, 2011.
[14] ACI 523 Committee. “Guide for Design and Construction with Autoclaved Aerated Concrete Panels”, ACI 523.4R-09, American Concrete Institute, Farmington Hills, MI, 2009.
[15] Masonry Standards Joint Committee (MSJC), “Specification for Masonry Structures”, ACI 530.1-05/ASCE 6-05/TMS 602-05, The Masonry Society, Boulder, CO, 2005.
[16] Masonry Standards Joint Committee (MSJC), “Building Code Requirements for Masonry Structures”, ACI 520-05/ASCE 5-05/TMS 402-05, The Masonry Society, Boulder, CO, 2005.
[17] Netherlands Normalisatie-Instituut (NNI), “Gasbetonproducten – Aerated Concrete Units” (NEN 3838), NNI Standard, Delft, The Netherlands, 1987.
[18] Aroni, S., RILEM Technical Committee 78-MCA., & RILEM Technical Committee 51-ALC. (1993). “Autoclaved aerated concrete: Properties, testing, and design: RILEM recommended practice”. London: E & FN Spon.
[19] Chen, Yu, et al. "Mechanical properties of autoclaved aerated concrete with different densities." Advances in Civil Engineering Materials 2.1 (2013): 441-456
[20] Ferretti, Daniele, and Elena Michelini. "The Effect of Density on the Delicate Balance between Structural Requirements and Environmental Issues for AAC Blocks: An Experimental Investigation." Sustainability 13.23 (2021): 13186.
[21] Michelini, Elena, et al. "Experimental investigation on the mechanical behaviour of AAC blocks for sustainable concrete masonry." Acta Polytechnica CTU Proceedings 33 (2022): 370-376.
[22] EN 772-1: “Methods of Test for Masonry Units - Part 1: Determination of Compressive Strength”; 2015.
[23] EN 1351:” Determination of Flexural Strength of Autoclaved Aerated Concrete”; 1998.
[24] JCI-S-001-2003: “Method of Test for Fracture Energy of Concrete by Use of Notched Beam”; 2003.
[25] Blaber, J., B. Adair, and A. Antoniou. "Ncorr: open-source 2D digital image correlation Matlab software." Experimental Mechanics 55.6 (2015): 1105-1122.
[26] Song, Yuanming, et al. "Feasibility study on utilization of municipal solid waste incineration bottom ash as aerating agent for the production of autoclaved aerated concrete." Cement and Concrete Composites 56 (2015): 51-58.
[27] Miccoli, Lorenzo, et al. “Composite UHPC-AAC/CLC Facade Elements with Modified Interior Plaster for New Buildings and Refurbishment. Materials and Production Technology”. Journal of Facade Design and Engineering 3.1 (2015): 91–102.
[28] Petrov, Ivailo, and Ernst Schlegel. "Application of automatic image analysis for the investigation of autoclaved aerated concrete structure." Cement and concrete research 24.5 (1994): 830-840.
[29] Holt, Erika, and Paula Raivio. "Use of gasification residues in aerated autoclaved concrete." Cement and Concrete Research 35.4 (2005): 796-802.
[30] Schober, G. "The most important aspects of microstructure influencing strength of AAC." AAC, Taylor (2005).
[31] Chiaia, B.; Fantilli, A.P.; Guerini, A.; Volpatti, G.; Zampini, D. Eco-Mechanical Index for Structural Concrete. Constr. Build. Mater. 2014, 67, 386–392